The Data
In order to protect the confidentiality of customer data and marketing strategies, the following information is taken in aggregate over 43 million leads. No email addresses, products purchased, nor any personally identifiable information were used in the analysis. All sales and marketing funnel data was combined for analytical purposes.
We then took our list of leads, and measured their Lead Value — the average amount of money that they’ve spent during any marketing campaign. We then correlated that to the amount of time they’re on the list, the number of emails they received, and the number of campaigns they went through.
In this article, we’ll go through:
- How much your leads should be worth
- When is the best time to sell
- Understanding refunds and delinquency issues
- The optimal price points for preventing refunds
- How long it takes leads to turn into customers
- And the importance of repeat customers
Takeaway #1: How much should your leads be worth?
Your lead value is one of the most important metrics in your business, and should be the top KPI that you keep an eye on. Understanding your lead value helps you determine if your marketing campaigns are making money, especially in the case of paid advertising.
If you spend more to get a lead than they end of bringing in, then your business is losing money.
We lose money on every sale,
but make it up in volume.
For any business, as long as your lead value is higher than what you pay to get the lead, you’re in the clear. But it’s sometimes hard to see if your lead value is optimized enough, or if you’re leaving money on the table.
It doesn’t help that since every business has a different business model, comparing lead values can be like comparing apples and oranges. Many companies are low margin, and make up for that in quantity, while many are boutique-style products, that have smaller lists with more devoted (and valuable) followings.
So let’s look at the data in aggregate, and then look at how boutique-style products can heavily influence what we think of as “normal” for Lead Value.
Across the leads we analyzed, the value of a given lead is $94.33 when taken in aggregate over all available lists. However, on any given list, the average lead value is only $54.74. Which means that many of the boutique-style lists pull up the overall value of leads on more standard lists.
HOWEVER, as we said, the difference between a boutique style list and a standard consumer list can make huge differences in lead value.
In order to find a more relatable Lead Value, we need to look at the breakdown of what percentage of lists have certain lead values.
If we break down the Lead Value by account, we see that the majority of lists are in the sub $5 range.
| Lead Value | Percentage |
|---|---|
| < $5 | 20.1% |
| $5 – $14 | 21.1% |
| $15 – $24 | 12.6% |
| $25 – $34 | 7.4% |
| $35 – $44 | 6.3% |
| $45 – $99 | 19.3% |
| $100 – $249 | 8.1% |
| $250+ | 4.9% |
It should be noted that the higher lead value lists don’t necessarily have higher revenue overall, just that they have a higher value per lead. For example, a list with 2400 leads on it with only $280,000 of sales would still have an extremely high Lead Value of $117.
So what should your Lead Value be?
As long as the cost to acquire a lead is lower than your lead value, you’re in the clear — the question then becomes, do you scale by increasing the number of leads, or by increasing the value of every lead that comes on to your list?
As a great example, on the Growth Lab blog, Brennan Dunn shared that for his email course he was able to get a lead value of $55.80 for his $2.50 Facebook ads.
Takeaway #2: Be mindful of other people’s sales calendar
Remember back to your school days, when your teachers would each give you an hours’ worth of homework, without considering that the other teachers were each giving you an hour as well.
While it might not be something that you often consider, the fact is that most people on your list are on other people’s lists as well. In fact, if your list is made of up of professionals, they may be on hundreds of lists, for every product they’ve ever signed up for.
In our dataset, we looked at 43,214,294 contact records spread over the accounts of multiple marketers. However, only a fraction of those contacts are unique. — according to our data, over 58% of all contacts belong to at least one other list, while many belong to up to 20 different lists. (One email address we found is on over 80% of our lists)
That means that for any launch marketing message that you’re sending out, other marketers are likely sending out mails at the same time. This can cause a serious dent in your predicted revenue if you launch at the same time as someone else in your space, or even just launch when people aren’t engaged with their inbox.
This is one reason why we promote evergreen sales as the way to go — enabling you to spread your revenue collection throughout the year instead of having to rely on the success of a single launch.
Sales over the year
Looking at our purchase data, we did an analysis of what days people purchased, and which timeframes were crowded, and which were fairly low-traffic, over the last 5 years.

This is a breakdown of the number of products sold during each day of the year.
As we can imagine, the worst sales weeks are the first and last weeks of the year. However, you’ll notice that the fourth week in January is a huge boost in sales, generally pushed by new-year-resolution purchases.
General sales tend to be lower in the summer and late fall months, with spikes created mainly through targeted sales efforts.
Sales by Day of Week

The day of the week also influences sales, with most sales being completed on Tuesday or Thursday. Sunday being the worst day for sales. This follows most launch style models, where we see that cart opens on Wednesday, Thursday is the major sales day, followed by friday when the cart closes.
Number of Sales by time of day
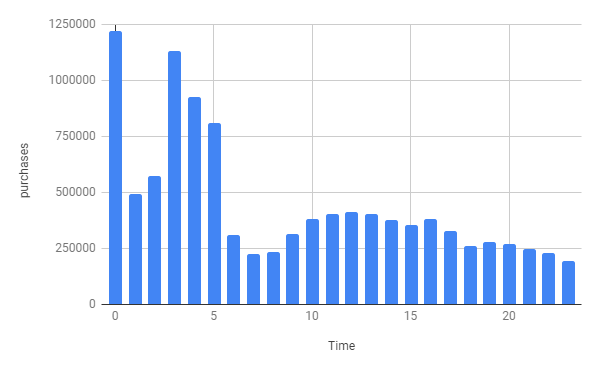
Interestingly, there is a heavy bias towards sales occurring at midnight to 5am Eastern Time, with a strong drop off after 6pm Eastern. Expiriring sales pages, often used in scarcity sales tactics, often expire at midnight Pacific time (3am Eastern), most likely accounting for the large blip in sales during midnight and 3am.
Recommendations
In our experience, even on Evergreen Funnels, following a solid date & time strategy can be key to increasing your sales. While the specifics change depending on your market, for most B2C products we see the following:
- Summer is the worst time to sell (Especially Late June & July) as people are traveling and many have kids at home
- Leading up to Christmas is good for physical products and gift-giving
- 3rd week of January is great for any “improvement” products as they tie in to New Year Resolutions
- Cart open on Wednesday, close on Friday at Midnight is a solid sales tactic that catches people as they’re winding down the week
- Follow up the cart close with a one-day “Last Chance” offer on Monday.
Takeaway #3: Beware of Delinquent Payments
One thing that comes from working with hundreds of marketing funnels and shopping carts is the understanding that a sale isn’t always a sale. Failed cards, delinquent payment plans and PEBKAC (Problem Exists Between Keyboard and Chair) issues can turn a celebration into a disaster.
In this analysis, we saw that 18% of sales revenue is still outstanding from unpaid invoices. That’s $432 million dollars of uncollected revenue caused by declined credit cards, defaulting on payment plans, or shopping cart errors that will report on revenue that was never collected.
This problem is especially important when you’re dealing with payment plans and other “collect later” offers like subscription payments, $1 initial offers and trip-wires, you need to be aware of how often your customers are becoming delinquent on their payments.
This is why we talk about PIF (Paid in Full) value versus the amount actually paid. You need to know your PIF value to understand how well a sales funnel is performing, while the amount collected will help you schedule your business’ cash flow.
Luckily, the delinquency rate for payment plans is not nearly as painful as above, showing only a 4.7% delinquency rate across all payments plans.
In other words, 95.3% of people who make at least one payment on their payment plan will complete all their payments. That means that if you offer a payment plan, make sure that you provide a service charge, or some extra fee to offset that 4.7% revenue loss.
Recommendations
Payment plans have a much higher rate of purchase than up-front plans, and we usually see around a 27% uptick on sales for payment plans when compared to Paid in Full plans.
Additionally, the number of months included in the plan can have a huge impact both on the sales (cheaper price over more months increases sales) and delinquency (longer payment plans means more chances for the customer to become delinquent).
We generally see the sweet spot to be 3-6 months of payments, with the price being 10% greater than the PIF version, in order to offset the potential delinquency rates.
Takeaway #4: The Perfect Price Point for Refunds
Like delinquent payments, refunds and their cousin chargebacks are the dirty little secrets of selling online that you usually don’t discover until it’s too late — and a quick way to turn a successful launch into a painful hole in your wallet.
Refunds and chargebacks are especially difficult for online companies, as credit card companies side with the consumer 9 times out of 10 for digital products. Additionally, as per Visa’s guidelines, customers can file a chargeback up to 540 days after the initial transaction.
One customer that we consulted with through SegMetrics found out that they had a consistent 15% refund rate on all of their sales funnels — and that jumped to 23% from sales made during launches.
So it’s in everyone’s best interest to make sure that customers are happy.
Luckily, refund rates are usually fairly low, and in the SegMetrics data set, we see that 3.95% of all purchases are eventually refunded, which applies to 4.12% of revenue.
Why the discrepancy in number of refunds versus their value?
Digging into the data, the price of a product has a huge impact on the refund rate. Cheaper products have an “oh well” factor that makes the hassle of asking for a refund more costly than the initial product, while products that are priced extremely ($2k or greater) are seldom bought on a whim, and have a lower refund rate.
| Product Price | Refund Rate |
|---|---|
| < $50 | 2.8% |
| $50 – $99 | 5.3% |
| $100 – $499 | 6.9% |
| $500 – $999 | 10.1% |
| $1000 – $1999 | 10.2% |
| $2000+ | 5.0% |
Interestingly enough, at the sub $50 level, there is a high variance in refund rates, with the 30 to 39 dollar range being the most susceptible to refunds.
| Product Price | Refund Rate |
|---|---|
| < $10 | 1.7% |
| $10 – $19 | 1.2% |
| $20 – $29 | 2.9% |
| $30 – $39 | 5.4% |
| $40 – $49 | 4.4% |
Recommendations
The best way to prevent refunds and chargebacks is to provide a great product, and to undersell and overdeliver. While there are always people looking to get a free lunch, the majority of people will not ask for a refund if they are satisfied with the product.
That being said, there are a number of strategies that you can do to both increase sales and combat refunds and chargebacks:
- Have a 365 day money-back guarantee. As we mentioned earlier, the time limit for a chargeback is over a year long. With a 365 day guarantee you’re providing assurance to potential customers, while not extending your refund period beyond that of a chargeback. Also, most people will not ask for a refund 12 months after they purchased something.
- Provide Stipulations for the money-back guarantee. This strategy works well, especially for payment plans or online courses. The idea is to get a signed document (using HelloSign or other online system) that says that the person agrees that they have to complete the course, do the homework, etc before they can get the refund. This gives you two benefits: First, it increases the perceived value of your product because of the “professionality” of having homework & an automated signing system. Second, it gives you a legal document that identifies that the customer actually purchased the product, which is useful in combating frivolous chargebacks.
Takeaway #5: How long does it take people to purchase
Wouldn’t it be great if as soon as a new lead joined your list, they instantly purchased and fulfilled their full lead value right there on the spot?
Unfortunately, that’s not the case, and most leads require quite a bit of education and nurturing before they turn into a customer. This is especially important for cold leads that are joining your list from paid advertising.
This time to purchase is an important aspect of planning your marketing funnel. You want to optimize your funnels so that leads convert quickly, but also bring in the optimum amount of value for your funnel. If you can sell a $10 product in the first 5 days, but sell a $100 product in two weeks, it would be beneficial to push the sales messaging back to optimize revenue.
If you’re working with paid advertising, knowing how long it takes to turn a lead into a customer is key to understanding the effectiveness of your ads, especially since most ad-tracking systems only report on revenue generated within 30 days of clicking an ad.
From the data, we went through and measured the amount of time it took from a lead joining the list until they make their first purchase. We then analyzed what happened to the time to purchase for different price points.
NOTE: Because of the large number of contacts who are created when they first make a purchase, we’re ignoring contacts that were created from a purchase event, which made up 16.7% of all customers.
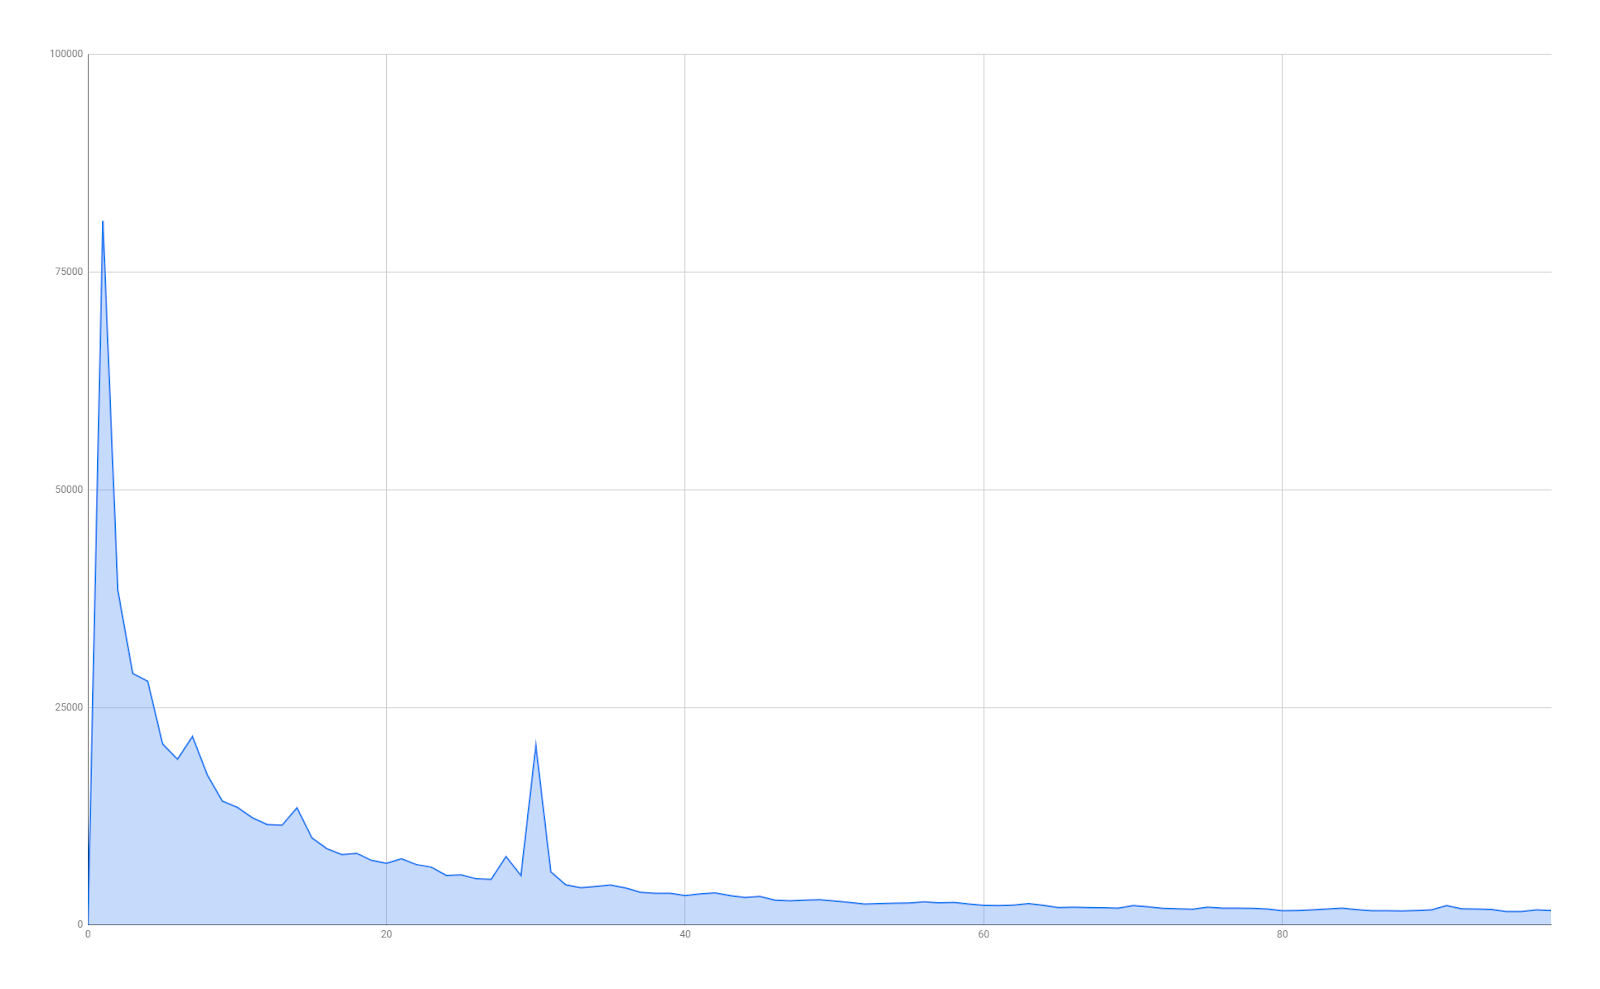
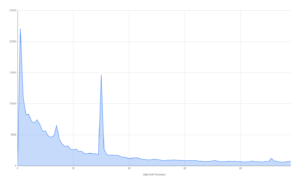
This is the analysis of how long it takes a customer to purchase once they join the list. It not only gives us a great understanding of how long it takes people to buy, but also the setup of many people’s marketing funnels.
The jumps in “first purchase” happen on day 1, 15 and 30 — which would tie to the lists’ nurture campaigns, which are usually set in 2 and 4 week intervals. After the 30 day mark, sales tend to slow down, but do not drop off, decreasing only 20% even after 600 days on the funnel.
While immediate sales are always a feel-good stat, it’s important to remember that your long-tail leads are often your best source of long-term revenue. Over all price points, 57% of revenue came after day 30.
Price Point Analysis
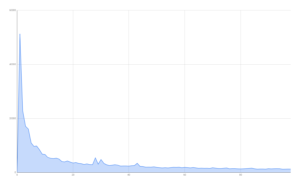
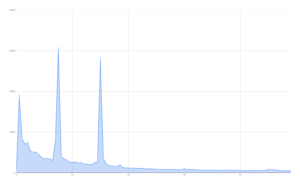
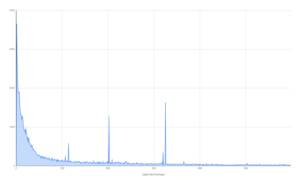
The various price points ($50, $100, $1000) all have similar trajectories to the overall graph. However, two points are interesting on the higher price point items.
The first is the $50 to $100 timeframe, which has a similar initial purchase rate to the other data sets, but the 15-day and 30-day sales emails fully eclipse the first week sales.
From our experience with marketing campaigns in this price range, this is most likely caused by a stronger email marketing funnel that delays that initial product offer until the 2nd and 4th weeks, so that they can craft a stronger narrative and nurture leads into buying the higher-priced product.
Secondly, in the $1000+ timeline, as we expect, products that are more than $1000 need more lead time for the initial sale, and we see large spikes in sales around the 100, 200 and 300 day marks. This is interesting, because where the sub-thousand dollar products flatten out after day 100, the higher-value products are able to increase sales through nurture emails and sales offers over time.
Especially for larger dollar products, you should keep educational sales funnels continuing throughout the lifetime of the contact even leads who haven’t purchased previously.
 |  |
 |  |
Recommendation
Don’t trust your Facebook or Adwords Ad Pixels to give you the real lead value for your paid marketing campaigns. When doing direct marketing, it’s important that you understand how people respond to your emails and funnels weeks, months and years after they join the list — as a $5 lead can be worth thousands of dollars over the course of a year.
“The probability of selling to an existing customer is 60-70%, while the probability of selling to a new prospect is just 5-20%”
—Market Metrics
Takeaway #6: The importance of customer value
It is a beautiful fact of business that customer value only increases over time. The ability to understand how often your customers purchase, and how much they purchase is key to building a sales funnel that can continually generate revenue from your most valuable asset — your existing customers.
This idea of repeat customers is summed up in what’s called an RFM (Recency, Frequency, Monetary) Analysis. This is a marketing technique used to determine which customers are your most valuable by looking at how recently (recency) a customer has purchased, how often they purchased (frequency), and how much they spend (monetary).
Looking at the Lifetime Customer Value (Monetary) data from the leads, we see that the customer value languishes at the low end of the spectrum for the majority of customers. It’s only until the 50% mark when the Lifetime Customer Value hits $120, and only the top 10% of customers ever hit double-digit lifetime value.

| List Percentile | Customer Value |
|---|---|
| 90% | $1010+ |
| 80% | $460+ |
| 70% | $260+ |
| 60% | $170+ |
| 50% | $120+ |
| 40% | $80+ |
| 30% | $60+ |
| 20% | $40+ |
| 10% | $20+ |

| List Percentile | Number of Purchases |
|---|---|
| 90% | 8+ |
| 80% | 4+ |
| 70% | 3+ |
| 60% | 2+ |
| 50% | 1+ |
The Frequency Report paints a similar picture — 50% of customers have only purchased one time. While we see that at the highest percentiles, some lists have repeating purchases hitting an average of 8+ purchases per customer, the majority of repeat customers is low.
Recommendations
“A 5% Increase in Customer Retention can mean a 30% increase in company profitability.”
—Bain & Company
Creating repeat customers can be one of the most challenging, but simultaneously rewarding, aspects of optimizing your sales funnel. However, in order for customers to become repeat buyers, they have to have something to buy, which means creating new products for them.
If you don’t have any products at the ready, here are a number of ideas to create additional content for existing customers:
- Do an interview series with leaders in your field and package them as an add-on to your existing product
- Turn your product into a monthly subscription package, and provide additional value for a monthly or annual fee
- Collect existing articles and content into a “quick guide”
Closing Thoughts: Do Your Marketing a Favor and See How Your Funnels Are Performing
You spend a lot of time and effort on your marketing funnels. Knowing how they perform, and the true value of your leads, is the key to growing your business.
Go through the metrics we talked about above, and see how your marketing funnels are performing compared to the rest of the industry.
Not sure how to get the numbers? Get our free guide (opt-in with the form below) and learn the specific steps to take to calculate your lead value for your opt-ins and lead magnets (or you can let SegMetrics calculate all these metrics for you in under 10 minutes).

