Most businesses throw gobs of money at marketing without really knowing which campaigns and channels bankroll the company...and which actually lose money.
You know how much you’re spending on PPC. Now find out exactly how many leads and how much revenue your advertising is really bringing in.
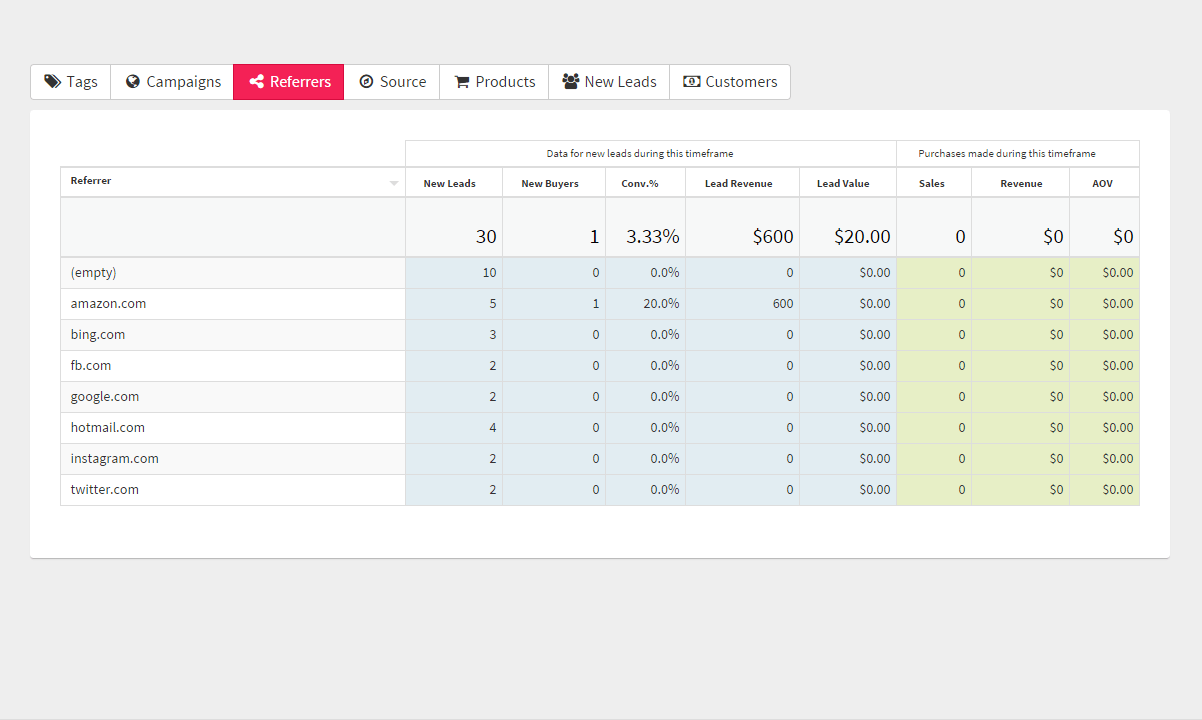
SegMetrics helps you drill down to find the top performing ads by new leads, buyers, conversion rate, revenue, AOV and more. Learn more about what metrics SegMetrics opens up.

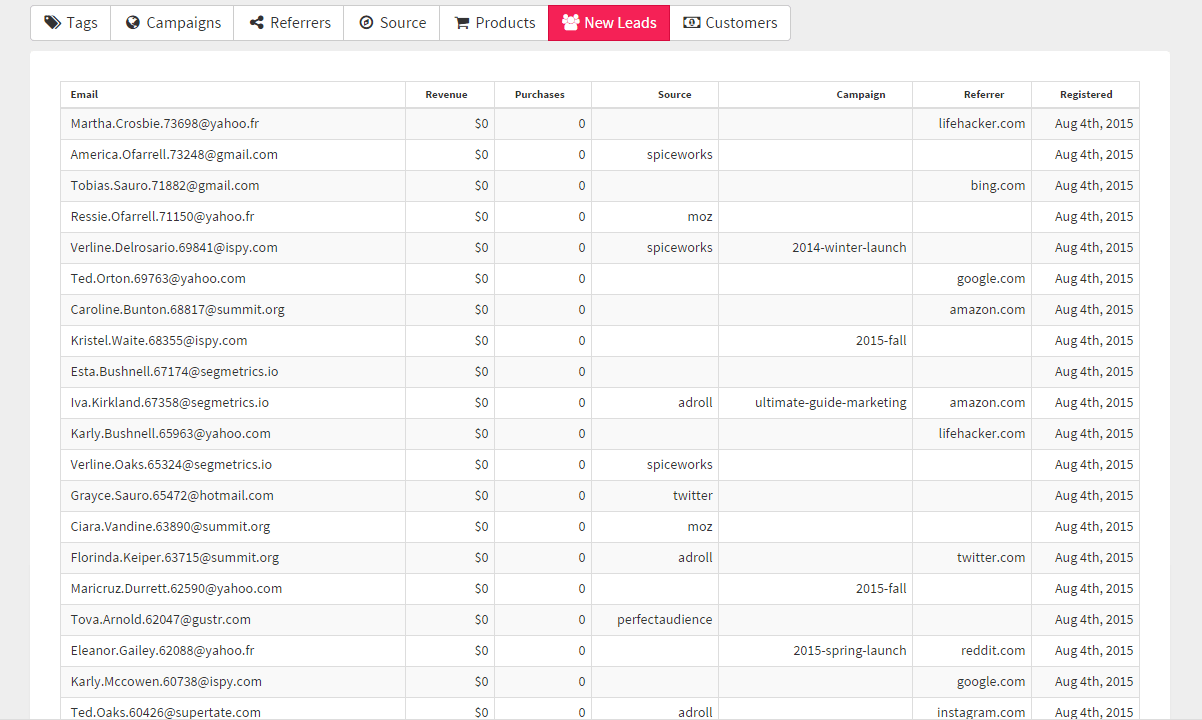
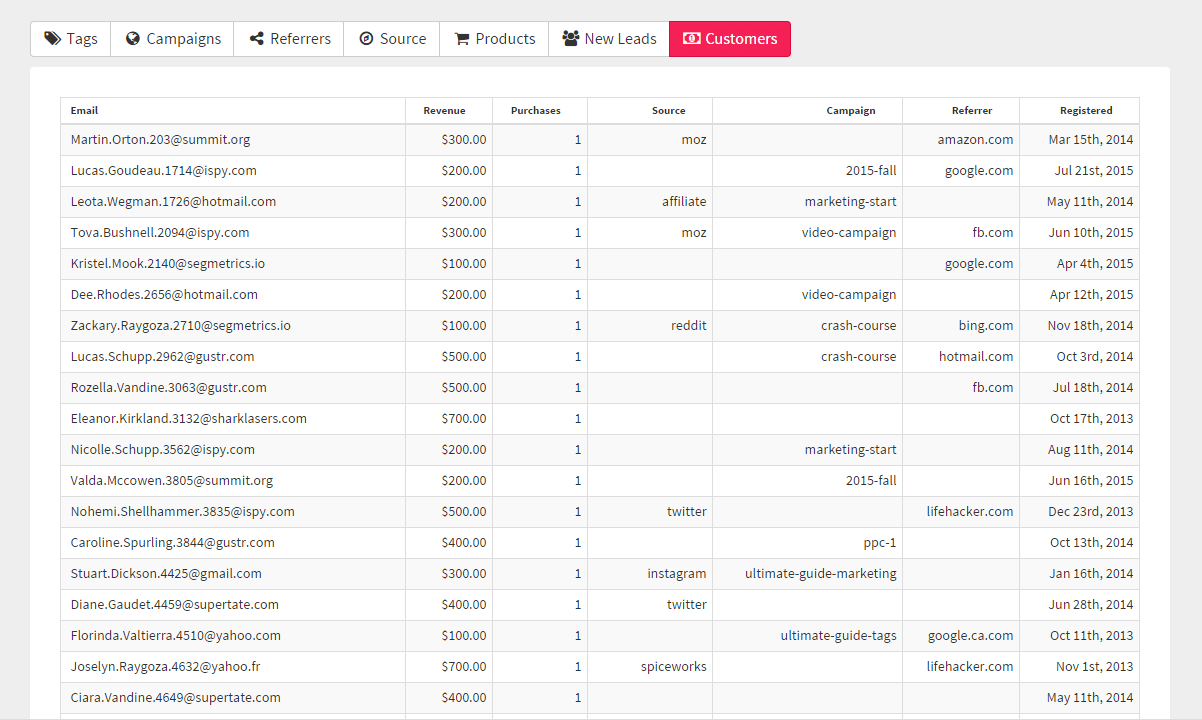
SegMetrics tracks all UTM codes, referring URLs and optin pages for every lead, then links each payment and purchase back to any of those attributions. See how money flows into your business — down to the penny — with 100% confidence in your data.
Already tracking your UTM parameters in your CRM? Just import your existing data into SegMetrics to sort and analyze your historical lead data along with all the other data SegMetrics unlocks for you.

Traditional lead source tracking in CRMs or Google Analytics is only skin-deep — it only attributes what it sees when a lead finally opts in. You never know if leads visit multiple pages first or opt in days later.
SegMetrics solves this problem. We track your leads from the moment they hit your site, then we follow your leads until they opt in so you get 100% accurate lead source attribution and campaign information. Multiple browsers, mobile users, repeat visits? No problem.

Was that Facebook ad the first experience a lead had with your site? How much will that lead bring you over the next 6 months? Can you correctly attribute those sales to the right campaign?
Now you can.
Since SegMetrics uses your actual sales data, straight from your payment platform, you don’t have to worry about missing data attributions, cleared cookies or different browsers. We connect every payment your customers make with the campaigns that first brought them to your site.

Find your most profitable lead sources, scale what works and kill what doesn’t.
Start Your 14-Day Free TrialIts easy to bet on the winners when you know who they are