Here’s a Black Friday horror story that’s unfortunately all too common…
You look at your BFCM sales and see they’ve gone through the roof. Awesome!
Oh, but your Cost Per Acquisition also went through the roof. That killed your Return on Ad Spend (ROAS). Now your margins have tanked.
You check again in several weeks. Refunds are also up. And that wave of new buyers? They aren’t repurchasing at the same rate. This drop in Customer Lifetime Value (LTV) is pinching your cash flow.
What happened?
Here’s the $1,000,000 lesson: Standard promotional goals don’t work for BFCM.
Revenue spikes that look impressive can actually hurt your long-term business if you’re not measuring the right things. On the flipside, customer acquisition costs that seem terrible in November might deliver exceptional returns by March.
What you’ll learn in this lesson:
- The three distinct BFCM strategic approaches and when to use each one
- Why standard metrics like ROAS and conversion rates work differently during BFCM
- How to set realistic expectations for customer acquisition costs during peak season
- The critical difference between BFCM revenue and BFCM profit
- A framework for measuring long-term value from BFCM campaigns
By the end of this lesson, you’ll have a clear strategic framework for your BFCM goals that aligns with your business model and sets realistic success benchmarks. No more January panic calls about “failed” BFCM campaigns.
The Three BFCM Strategic Approaches
Before you set a single BFCM goal or choose any metrics, answer this question: What is BFCM actually supposed to accomplish for your business?
This isn’t as obvious as it sounds. Most businesses default to “make more money,” but that’s not a strategy. BFCM success requires choosing ONE primary strategic approach and aligning everything else around it.
Here are three distinct BFCM strategic approaches, each with different goals, tactics, and success metrics. Pick one as your primary focus.
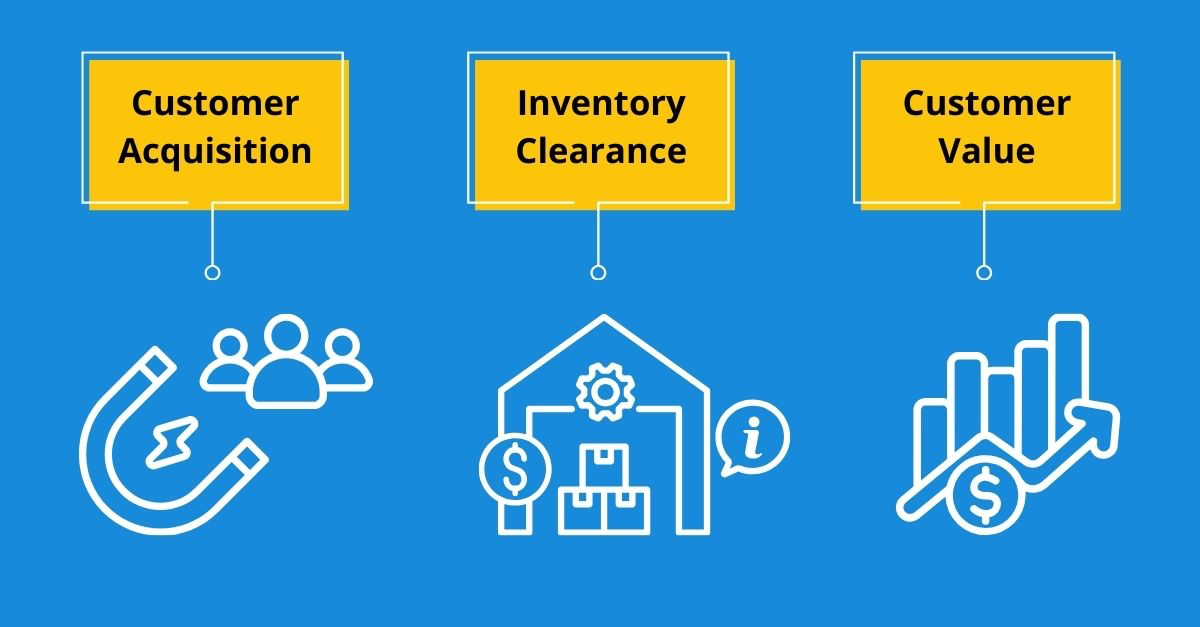
Customer Acquisition Strategy
This approach treats BFCM as your biggest customer acquisition opportunity of the year. You’re using the cultural shopping momentum to bring new people into your ecosystem, even if it means lower short-term profitability.
When to use this approach:
- You have proven lifetime value models for customers
- Your business has predictable upsell/retention patterns
- You can afford lower short-term ROAS for long-term growth
- Your customer acquisition typically requires multiple touchpoints
Typical goals:
- Email list growth targets (specific subscriber increases)
- First-time buyer acquisition (new vs. returning customer ratios)
- Market expansion (reaching new demographics or geographies)
- Brand awareness in competitive landscapes
Success metrics that actually matter:
- Customer Acquisition Cost (CAC) compared to lifetime value projections
- List growth rate and engagement quality of new subscribers
- New vs. returning customer ratio (aim for higher new customer percentage)
- Geographic or demographic expansion metrics
- 90-day retention rates for BFCM-acquired customers
Customer Acquisition Insight
If you’re playing the acquisition game, your BFCM campaign might look “unprofitable” in December but deliver exceptional returns throughout the following year. You will need full-funnel tracking with lifetime attribution in order to accurately measure the LTV of the customers you acquire. We can help you set this up fast with our Express Data Set-Up.
Inventory Clearance Strategy
This approach treats BFCM as operational efficiency rather than growth marketing. You’re optimizing for cash flow, inventory turnover, and business operations rather than customer lifetime value.
When to use this approach:
- You have physical inventory that needs to move
- Seasonal products require end-of-year clearance
- Cash flow improvement is more important than growth
- You’re preparing for new product launches in Q1
Typical goals:
- Sell-through rates for specific product lines
- Inventory reduction targets (units or dollar amounts)
- Cash flow improvement for operational needs
- Warehouse space optimization
Success metrics that actually matter:
- Units moved vs. inventory targets
- Cash generated vs. cash flow requirements
- Inventory turnover rates compared to normal periods
- Profit margin preservation despite discounting
- Storage cost reduction and operational efficiency gains
Inventory Insight Insight
Clearance strategies should optimize for volume and cash generation, not customer lifetime value or retention metrics.
Customer Value Maximization Strategy
This approach focuses on extracting maximum value from your existing customer relationships during their highest-spending period of the year.
When to use this approach:
- You have strong existing customer relationships
- Your products have natural upsell/cross-sell opportunities
- Higher-ticket items benefit from increased spending willingness
- Service-based businesses wanting to monetize existing trust
Typical goals:
- Average Order Value (AOV) increases from existing customers
- Purchase frequency improvements
- Premium product adoption rates
- Customer lifetime value acceleration
- Product line expansion (people buying products or services from you they normally don’t)
Success metrics that actually matter:
- AOV increase compared to normal periods
- Customer purchase frequency changes
- Premium vs. basic product adoption rates
- Existing customer engagement and repeat purchase rates
- Revenue per existing customer improvements
Customer Value Insight
This strategy works best when you have established customer relationships and focus on deepening them rather than broadening them.
Why Standard Metrics Break During BFCM
Here’s a head-scratcher: Your normal KPIs will look terrible during BFCM, but that might actually be a good sign. If you understand the nuances of this, you can still achieve your strategic objectives.
Let’s break it down.
The ROAS Reality
Expect to see a drop in ROAS during BFCM. This isn’t a sign of campaign failure, it’s the natural result of increased competition driving up placement costs for advertising. When every business increases their advertising spend simultaneously, costs rise and efficiency decreases across the entire market.
What this means for your planning:
- Budget for lower ROAS during BFCM periods
- Focus on absolute revenue and strategic goals rather than efficiency ratios
- Plan attribution analysis over longer timeframes
- Set ROAS expectations based on BFCM benchmarks, not normal performance
- Watch your CPC numbers closely and prepare to quickly adjust bidding strategies
Attribution Challenges
Normal attribution models assume customers follow predictable paths from awareness to purchase. BFCM breaks these assumptions.
During peak season, customers might see your ad on Facebook, research on Google, compare options on multiple sites, discuss with family members, and purchase on a separate visit via a different device. Traditional attribution models can’t capture this complexity.
What this means for your planning: You need full-funnel, cross-platform tracking that calculates true LTV. Without this, you’re flying blind as to how each piece of your marketing is actually performing – or not. (Click here to talk to one of our analytics experts to evaluate your current tracking system.)
Short-term vs. Long-term Value
The most dangerous BFCM measurement mistake is optimizing for immediate results rather than strategic outcomes.
For example, a customer acquired for $50 during BFCM might generate $30 in immediate revenue, looking like a loss. But if that same customer makes three additional purchases over the next six months, the total relationship value might be $200. The “losing” campaign actually generated $150 in long-term profit.
On the flip side, if your BFCM generates a lot of low-value, one-time-only buyers, that might look like a flop. But if the goal was to clear out a bunch of old inventory and that’s exactly what these buyers did, that’s a success.
You need to be clear on your goals before you can be clear on your data.
The Lifetime Value Trap
Many businesses calculate customer lifetime value (LTV) using historical data, then apply those calculations to BFCM-acquired customers. This can be misleading. BFCM customers often have different engagement patterns, purchase timing, and retention rates than customers acquired during normal periods. Use separate LTV calculations for peak season acquisitions, and measure them over longer timeframes before drawing conclusions.
Setting Realistic BFCM Expectations
Your BFCM goals should reflect your business reality, not your wishful thinking. This starts by shaping your BFCM around stage of business that you’re in.
Launch-stage businesses (0-2 years):
- Focus on proof of concept rather than scale
- Prioritize learning over revenue maximization
- Set conservative goals with higher margins for error
- Emphasize list building and market validation
Growth-stage businesses (2-5 years):
- Balance growth with profitability
- Test new customer segments or product offerings
- Set aggressive but achievable acquisition goals
- Focus on systems and process optimization
Scale-stage businesses (5+ years):
- Optimize for efficiency and customer lifetime value
- Leverage existing customer relationships for value maximization
- Set goals based on historical BFCM performance
- Focus on market share protection and expansion
The 4x Reality Check
If you don’t have historical BFCM data to work with, here’s a useful starting benchmark: the average company experienced a 4x increase in daily sales, revenue, and traffic during the 4-day BFCM window compared to their pre-holiday baseline.
This 4x multiplier can serve as your initial framework if you’re planning your first BFCM campaign or if your business has changed significantly since your last Black Friday promotion. However, remember that this is an average, your actual multiplier will depend on your industry, business model, and execution quality.
How to apply the 4x benchmark:
- Calculate your average daily revenue for October (pre-holiday baseline)
- Multiply by 4 to get your conservative BFCM weekend revenue target
- Multiply by 5-6x for realistic stretch goals if your execution is strong
- Use the same multiplier approach for traffic and customer acquisition targets
This benchmark is particularly useful for setting advertising budgets and operational capacity planning when you don’t have your own historical performance data to reference.
Timeline Expectations
BFCM success rarely shows up immediately. The most successful campaigns often have their biggest impact months after the promotional period ends.
Realistic measurement timelines:
- Week 1-2 post-BFCM: Revenue, conversion rates, immediate metrics
- 30 days post-BFCM: Customer engagement, repeat purchase signals, retention indicators
- 90 days post-BFCM: True customer lifetime value, long-term retention, business impact
- 6 months post-BFCM: Complete strategic assessment and planning for following year
The January Reality Check
January is when BFCM reality hits. Returns increase, credit card chargebacks arrive, and the true quality of your customer acquisitions becomes clear. Plan for this by setting aside customer service resources, preparing return/refund processes, and tracking metrics through the entire post-holiday period. Many “successful” BFCM campaigns fall apart in January due to poor post-purchase experience planning.
Competitive Context
Your BFCM performance should be benchmarked against industry standards during peak season, not against your own normal performance.
If your usual conversion rate is 3% and it drops to 2.1% during BFCM, that might actually be excellent performance if your industry average during BFCM is 1.8%. Context matters more than absolute numbers.
When evaluating your performance, be sure to research industry-specific BFCM performance data. Check non-competing businesses in similar markets. Platform-provided benchmarks (Facebook, Google, email providers) can give you useful context here. Bottom-line, be sure to focus on relative performance rather than absolute metrics
B2B BFCM Metrics
B2B businesses should measure BFCM differently than B2C. While consumer businesses focus on immediate purchases, B2B success often shows up as increased lead quality, accelerated sales cycles, or higher deal values in Q1. Track metrics like qualified lead increases, sales cycle compression, and deal value improvements rather than immediate revenue generation.
Key Takeaways
- Choose one primary BFCM strategy rather than trying to optimize for everything. Mixed strategies lead to mediocre results across all objectives.
- Expect standard metrics like ROAS to decline during BFCM due to competitive pressure. Plan accordingly and measure success over 6-month periods rather than promotional weekends.
- Benchmark performance against industry BFCM standards, not your normal business metrics. A 2% conversion rate during BFCM might be better than your usual 3% if your industry averages 1.5% during peak season.
What to Do Next
Before planning any BFCM tactics, complete this strategic framework exercise:
- Choose your primary BFCM strategy: Review the three approaches and select the one that best fits your business stage and resources
- Define 3-5 success metrics that align with your chosen strategy, ignore vanity metrics that don’t support your primary objective. Set realistic benchmarks by researching industry performance during previous BFCM periods rather than extrapolating from your normal business metrics
- Make sure that your analytics system supports full-funnel, cross-platform tracking — with lifetime attribution. This is essential for fully understanding and optimizing your BFCM results. Talk to one of our analytics experts if you have questions or need help setting this up.
In our next lesson, we’ll use this strategic framework to tackle the biggest BFCM challenge: standing out in a marketplace where everyone is screaming about deals and discounts.