You made it through BFCM. How did you do?
This question can be surprisingly hard to answer.
For example, a company might post $180,000 in sales during BFCM – a company record. Seems great. But then refunds ate up 23% of that revenue. Customer service costs had tripled due to gift-related inquiries and delivery complaints. Chargebacks from unauthorized gift purchases hit another 8%.
Come end of February, that “record-breaking” campaign has generated less than half the profit they saw in early December.
Welcome to the advanced Black Friday work! It’s critical to understand – and track – how immediate success metrics often hide long-term problems, while apparent failures sometimes deliver exceptional value months later. (Have we mentioned how BFCM isn’t like other promotions? Well, here’s another example.)
What you’ll learn in this lesson:
- How to track your real-time BFCM results
- How to calculate true BFCM profitability including hidden costs and delayed value realization
- Attribution modeling strategies that capture cross-channel customer journeys during peak season
- Customer lifetime value analysis specifically designed for BFCM-acquired customers
- Competitive benchmarking frameworks that provide context for performance evaluation
- How to identify actionable insights that improve future campaigns rather than just measuring past performance
By the end of this lesson, you’ll have a performance analysis framework that measures what actually matters for your business success and reveals specific optimization opportunities for sustainable growth.
Tracking your BFCM results
Tracking your Black Friday and Cyber Monday results is essential for understanding which promotions, channels, and strategies delivered the best return on investment. By monitoring key metrics like conversion rates, average order value, traffic sources, and customer acquisition costs in real-time, you can quickly identify what’s working and make adjustments mid-campaign to maximize revenue. This data also reveals which products resonated most with customers and which marketing channels drove the highest-quality traffic.
Beyond immediate optimization, comprehensive tracking provides invaluable insights for future holiday seasons and year-round marketing strategies. Analyzing post-sale metrics like return rates, customer lifetime value, and repeat purchase behavior helps you understand the true profitability of your holiday campaigns. This historical data becomes the foundation for setting more accurate goals, allocating budgets more effectively, and crafting more targeted promotions for next year’s holiday shopping events.
Most companies have a fractured, incomplete view of their Black Friday results. This is because their marketing data is fractured and incomplete.
- Their email data? Locked in their email platform.
- Their ad data? Locked in their ad platforms.
- Their sales data? Locked in their payment processor.
And so on through their full tech stack. This makes tracking and optimizing your Black Friday results near impossible.
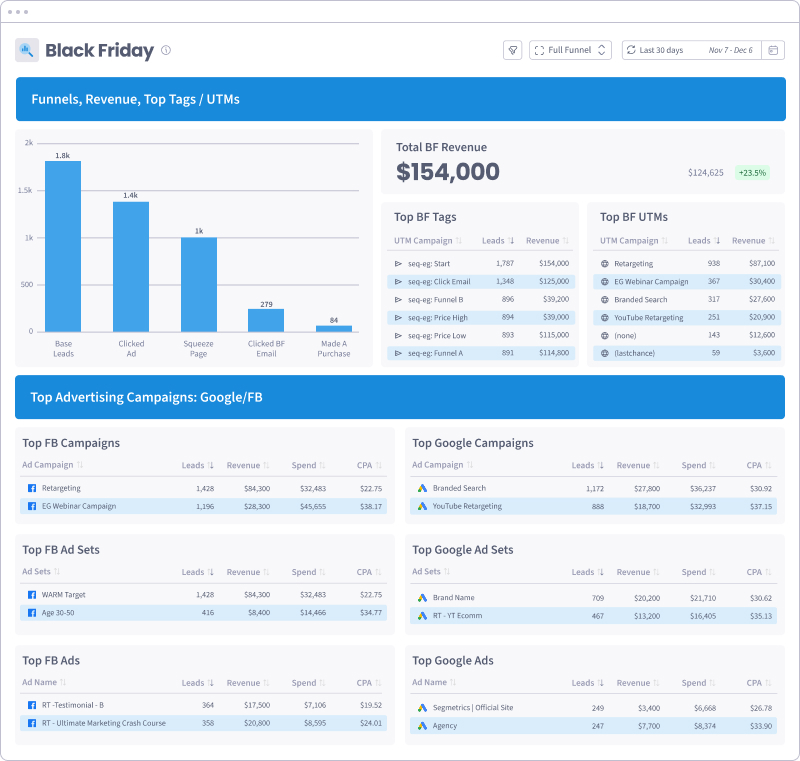
Our Black Friday Dashboard gives you a single source of truth for your BFCM results. And because it’s built in SegMetrics, it connects to all of your marketing tools and gives you 100% verifiable data.
Sign up for a 14-day free trial of SegMetrics and get our custom Black Friday Dashboard for free (a $250 value).
The hidden costs of BFCM
BFCM campaigns generate unique costs that don’t appear in regular promotional analysis. For example:
- Customer service hours often spike due to gift-related inquiries, delivery deadline stress, and return processing.
- Refund rates increase because promotional pricing attracts price-sensitive buyers with higher return propensity
- Chargeback rates rise significantly due to gift recipients who didn’t authorize purchases or family members who forgot about shared credit cards.
- Additional fulfillment costs emerge from rush shipping promises and holiday packaging requirements.
- Payment processing fees multiply with higher transaction volumes and international gift purchases.
We recommend you plan for customer service costs that are 30-50% higher during January to handle post-BFCM issues.
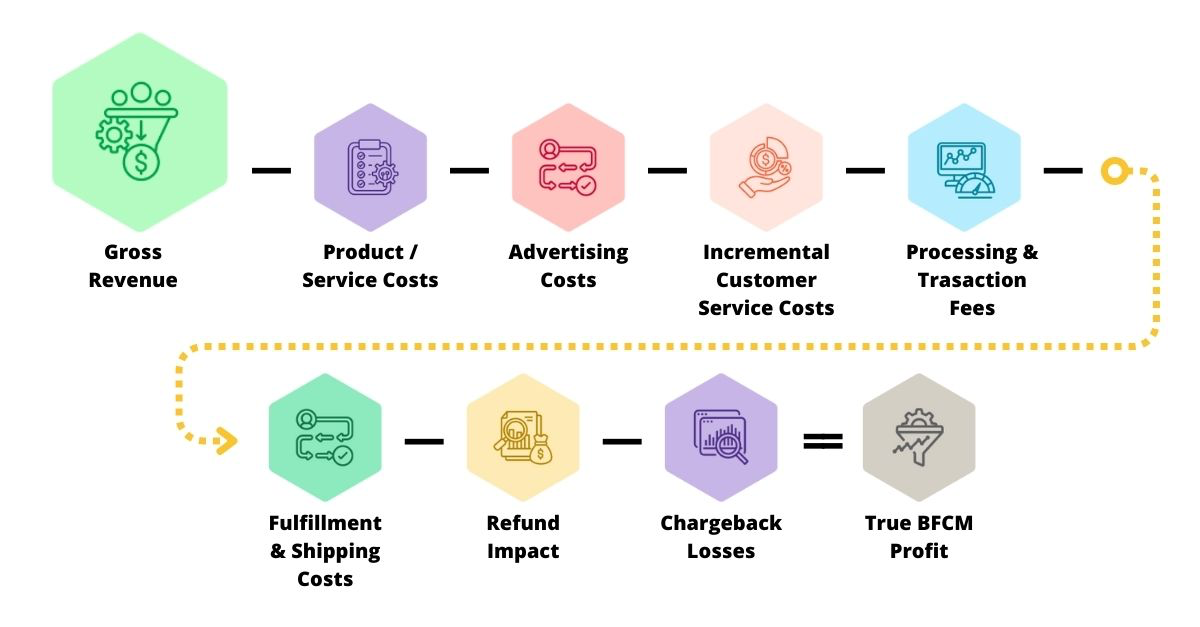
Tracking all of these impacts is critical because true BFCM profitability requires expanded calculations. Here’s the math:
Gross Revenue minus Product/Service Costs minus Advertising Spend minus Incremental Customer Service Costs minus Processing and Transaction Fees minus Fulfillment and Shipping Costs minus Refund Impact minus Chargeback Losses equals True BFCM Profit
When do you measure BFCM profitability?
We recommend tracking your BFCM profitability over 6-12 months to capture the full and delayed lifetime value of your BFCM leads and customers.
To do this properly, you will need a cross-platform, cross-device, full-funnel tracking tool with lifetime attribution. SegMetrics connects all of your marketing tools — ad platforms, email providers, website, CRM, payment processors and more — to give you a transparent, verifiable, single source of truth for your marketing data. You can’t optimize your marketing without clear and accurate LTV data across all your channels and segments.
(For a private tour of SegMetrics, book a call with our of analytics experts: https://segmetrics.io/book-a-demo/.)
The ROAS Deception
A software company panicked when their Black Friday ROAS dropped from 340% to 180%, thinking their campaign failed. But when they calculated true profitability – including customer lifetime value – their “terrible” BFCM customers had 67% higher long-term value than regular acquisitions. The lower ROAS reflected market competition, not campaign failure. Don’t judge BFCM success by normal performance metrics! Competitive context changes everything during peak season.
Attribution and customer journey analysis
BFCM attribution operates as a complex system where traditional models break down completely. For example, during peak season, customers might see your Facebook ad, research on Google, compare options on multiple sites, discuss with family members, and purchase days later on a different device.
Traditional last-click attribution models miss this complexity entirely. You need attribution approaches designed for BFCM behavior patterns.
Here are some tactics for making the most of your BFCM tracking:
- Extended Attribution Windows: Use 14-30 day attribution windows instead of standard 7 days to capture delayed decision-making patterns.
- Assisted Conversions: Track multi-touch attribution to understand channel interactions rather than final clicks. (This can be particularly helpful with iOS privacy updates limiting tracking accuracy.)
- Cross-Device Tracking: Account for research-on-desktop, purchase-on-mobile behavior that dominates BFCM shopping. This means if your analytics can’t handle cross-device tracking, then you’re not getting an accurate picture of your BFCM campaign.
- Leading Indicators: Track metrics that predict attribution accuracy: brand search volume increases (indicating awareness lift), direct traffic growth (suggesting brand recall), email engagement improvements (showing list quality), and organic social mentions (measuring viral amplification). Being able to connect this data with LTV after your first BFCM campaign will help you read more into the leading indicators on subsequent years.
Advanced tips for reviewing your BFCM data:
- Use view-through attribution windows longer than normal campaigns
- Track assisted conversions, not just last-click attribution
- Monitor brand search volume increases as leading indicators
- Focus on contribution analysis rather than direct attribution
BFCM benchmarking
When judging your Black Friday success, be careful about comparing your performance against others. A 2.1% conversion rate during BFCM might represent excellent performance if your industry averages 1.8% during peak season, even though your normal conversion rate is 3%.
When you try to benchmark your results, keep the following in mind:
- Compare your metrics against industry BFCM averages, not your normal metrics.
- Be sure to use benchmarks related to your business stage. Early vs. growth vs. established companies perform differently.
- BFCM results can vary based on which channels you focus on.
- Conversion rates can be device-specific – particularly for mobile vs desktop performance
- B2B and B2C results can vary significantly during BFCM. (B2B BFCM success shows up as increased lead quality and accelerated sales cycles in Q1, not immediate purchases.)
- Different industries perform differently during Black Friday, too.
Of course, it’s often impossible to find perfect competitor or industry BF benchmarks. That’s why the best benchmark for your BFCM results is how you did the year before.
If you want a broad yardstick for results, you can use our research which showed the average company experienced 4x increases in daily sales during BFCM weekend. Use this multiplier as a baseline expectation: multiply your October daily average by 4 for conservative targets, by 5-6x for realistic stretch goals.
B2B Benchmarking
Beware of industry benchmarks! They can be misleading if they don’t match your business model. A B2B service company compared their performance to B2C ecommerce benchmarks and concluded their BFCM campaign failed. Actually, B2B BFCM success shows up as increased lead quality and accelerated sales cycles in Q1, not immediate purchases. Use benchmarks from similar business models and sales cycles rather than generic industry averages.
Key Takeaways
- True profitability requires comprehensive cost analysis beyond immediate revenue. Factor in customer service spikes, refund rates, and other costs to understand actual BFCM business impact.
- BFCM attribution demands extended windows and contribution analysis rather than last-click models. Cross-device behavior and compressed decision timelines break traditional attribution completely.
- Benchmarking provides essential context for performance evaluation. Your metrics only make sense relative to industry performance during peak season, not your normal operations. Or better – how you performed last year.
What to Do Next
Before moving to our final lesson, set up cross-platform, cross-device, full-funnel tracking with SegMetrics. Sign up for a 14-day free trial of SegMetrics and get our custom Black Friday Dashboard for free (a $250 value).
In our final lesson, we’ll start planning next year’s campaign with insights that drive continuous improvement.