Sam has an online music course that she has been running for 4 years.
The market has become increasingly crowded, so she had started running paid ads with the help of a PPC consultant, along with running a 30 Day Challenge.
Her funnel was fairly normal. She had a strong following with her free content on Youtube, where she occasionally promoted her lead magnets. Subscribers then went through an email funnel leading to a sales page for her paid course.
She was skeptical about whether she was getting a solid ROI from her campaigns. The ad platforms couldn’t give her reliable data about generated revenue, with Google and Facebook often conflicting and not matching up with her actual revenue.
Bad data meant she couldn’t be certain she was properly identifying issues in her funnel or successfully testing changes.
[Note: “Sam” is an amalgamation of various true stories from SegMetrics users, not a single person]
The plan of attack
Sam needed a reliable way to assess her whole funnel. She needed to know the ROAS based on lifetime value, with ways to test how each piece was affecting revenue.
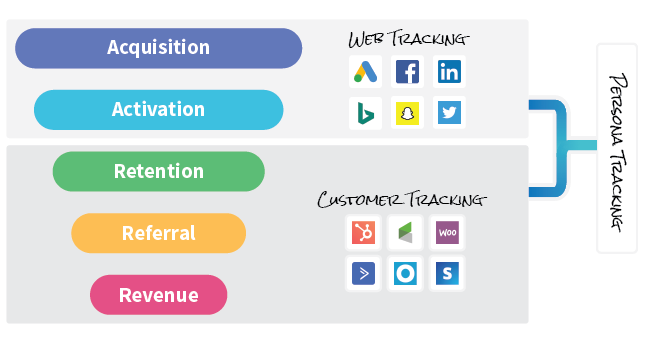
SegMetrics let her do just that, with traceable data and multi-purchase attribution.
She decided that she needed to form a plan instead of jumping into the software with guns blazing. Her to-do list became:
- Optimize the web traffic to ensure that it’s profitable instead of burning money
- Maximize average order value (AOV) so she’s not leaving money on the table
- Improve retention in the middle funnel with relevant and engaging content
These are prioritized both by urgency and ease. The middle of funnel has the most moving pieces and can be the murkiest to optimize, so is best left until after the quicker wins of TOF and MOF.
With a plan in hand she was able to tackle these three challenges.
What’s my ROAS?
Top of funnel (TOF) is where quick wins are usually found, as there is great data waiting to be uncovered. The core goal is to ensure that every campaign has a positive ROI.
The core question was whether the $3k/month she was spending on ads was creating a positive return on investment. So, she looked at lifetime revenue from each campaign she was running.
Evaluating her 30 Day Challenge
Sam had a new 30 Day Challenge that she was paying to promote. Her PPC consultant was excited as it was bringing people in for only a $20 CPA, but was unable to say how that translated into money in the bank.
Google and Facebook were unable to track leads over the long sales cycle, while her customer data wouldn’t say how many of her sales were a result of the challenge.
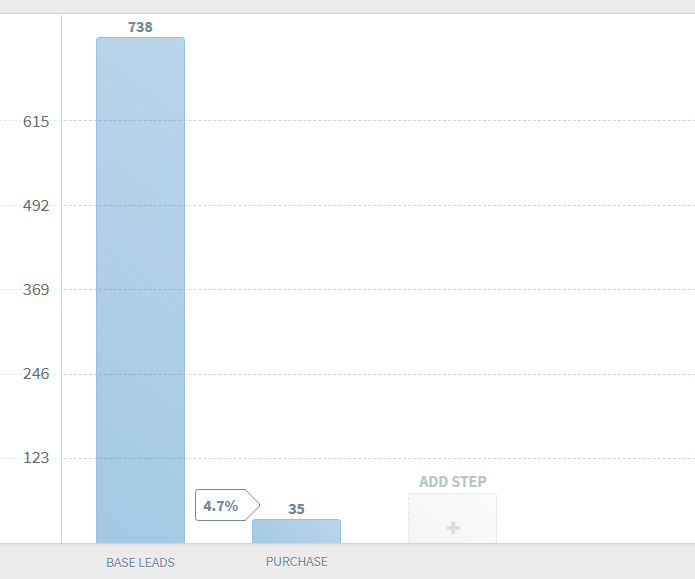
With SegMetric’s Ad Report she could instantly see how much she made from people purchasing after the 30 Day Challenge… and the news was terrible.
She had an Ad Spend of $9,452 to promote the challenge, but the revenue from the attendees was only $1,700, meaning a loss of $7,752 and RoAS of only 18%.
Promoting her challenge was burning through money while making a loss. She immediately paused the campaign with plans to reassess the strategy.
| Lesson: Number of leads and CPA are just a vanity metrics unless you can also measure the revenue from a campaign |
Not all lead sources are created equal
She had also been running ads direct to her sales page on Facebook and YouTube.
On the face of it both were successful, with a Customer Acquisition Cost (CAC) of around $80. Some back of the envelope maths had given her a customer value of $125, averaged across all of her customers.
But, she had assumed that customers from different sources would spend similar amounts. There had been no way to compare how much customers from organic, video ads, display ads and social were spending, especially considering her program was a monthly subscription.
SegMetric’s Revenue Report was able to segment her contacts by source, showing how the customer value varied.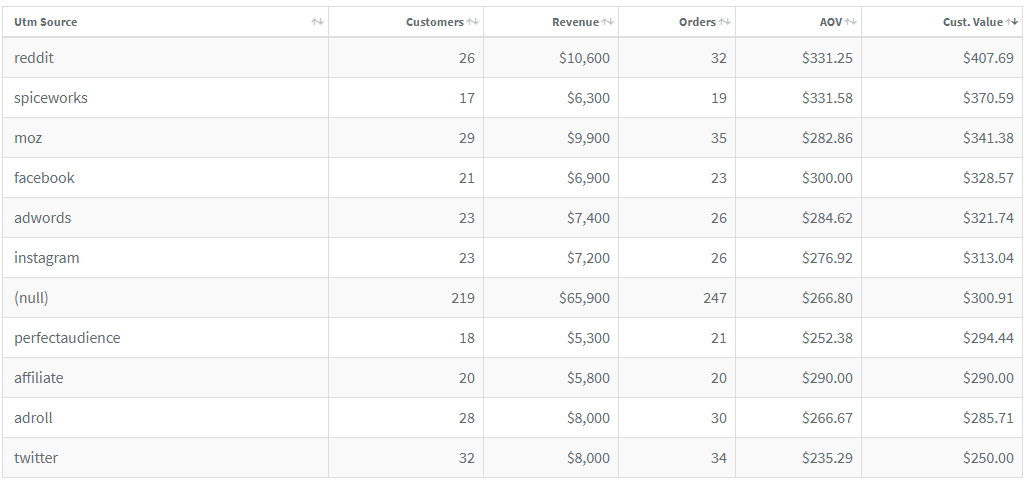
It showed an almost 3x variation between the most and least valuable customer sources!
She could see that customers from Facebook spent $180, but ones from YouTube only spent $60. So, a CAC of $80 for YouTube ads was losing her money.
Her top-level numbers had hidden this variation, so again she took a step back to find the issues before wasting more money on underperforming ads.
| Lesson: Looked at overall averages can hide crucial variations that are secretly wasting your money |
Finding the best upsell combinations
Bottom of funnel is all about improving conversions and average order value, through testing different sales pages or offer combinations.
Now that Sam’s ad budget was all allocated to profitable campaigns, she could focus on improving the AOV.
Over the years Sam had built up a small array of core products and potential upsells, downsells and cross-sells. She had used her best guesses to match them up, but again there was no real way to test what decisions lead to the most sales.
Her sales data could tell her the total she had sold of each product, but not how different pairs performed.
Yes, you’ve guessed it, she took a look at the data in SegMetrics
It automatically showed how pairs of products were selling together based on the customer invoices. With a few clicks she had a table of how each order bundle was selling.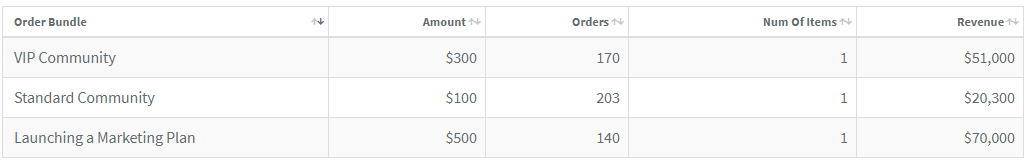
She could see that while the Essential Scales eBook had more orders, her Private Lesson Bundle lead to double the revenue due to the higher cost.
By focusing on this upsell Sam realized she could easily raise the AOV, which in turn would mean she could afford a higher CAC.
| Lesson: Bottom of funnel is an undervalued opportunity for optimizing revenue, especially testing ways to boost the average order value |
A way to finally analyze email sequence performance
Middle of funnel can be tricky to optimize due to the complexity, but the aim is to ensure it is maintaining attention and building the desire for the proposed solution.
Sam now had a profitable funnel, with good traffic and popular offer combinations. That gave her the headspace to give her email sequences attention.
The email platform gave her the usual metrics around clicks, open rates and revenue per email.
But like with ad revenue attribution, there was no inbuilt way to see how much a group spent after going through a particular email sequence.
For research purposes, she had been asking people about their musical experience when they submitted their email. She had wondered whether beginners and advanced students were equally likely to join her course, but again there had been no easy way to tell since customer data is in a separate silo.
So Sam went into SegMetrics to look at how these groups were moving through her funnel.
At an overall level she could see a gradual drop-off through her funnel as would be expected.
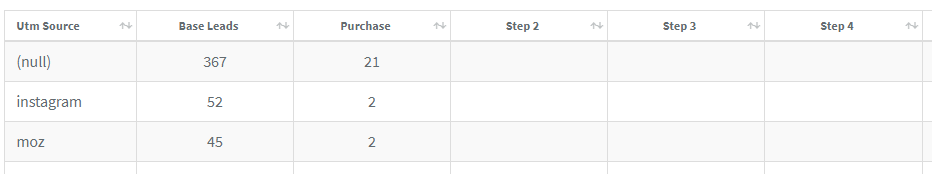
However the table revealed a few surprising details:
- Most of her leads were beginners
- Most of her revenue was from advanced
- The beginners all dropped off around emails 3 and 4
She went back to her email funnel and saw that emails 3 and 4 are when she starts to introduce more nuanced topics which were clearly alienating beginners.
Sam realized she had to write a whole new email sequence for beginner that would keep them interested, while also finding ways to get a higher number of advanced students into her top of funnel.
| Lesson: Viewing how different groups or sources move through the funnel can be a valuable method to find drop off points and opportunities for optimization. |
Epilogue: And she funneled happily ever after
With her funnel stages all working together, Sam could finally stop stressing (as much) about her business.
She could see that her course marketing budget had a healthy ROI, while her funnel lead to a higher and higher LTV.
Sam even tried revisiting the 30 Day Challenge she had paused. The improved MOF and BOF meant that these leads converted far higher so the challenge became profitable.