Template created by

Conversion Overview

Track your BOFU performance. See the last-touch moments that drive revenue.

4.7/5 based on 2,374 reviews | GDPR Compliant

The truth about your customer conversions

Top-of-funnel metrics get all the attention. But bottom-of-funnel clarity? That’s where the money lives.

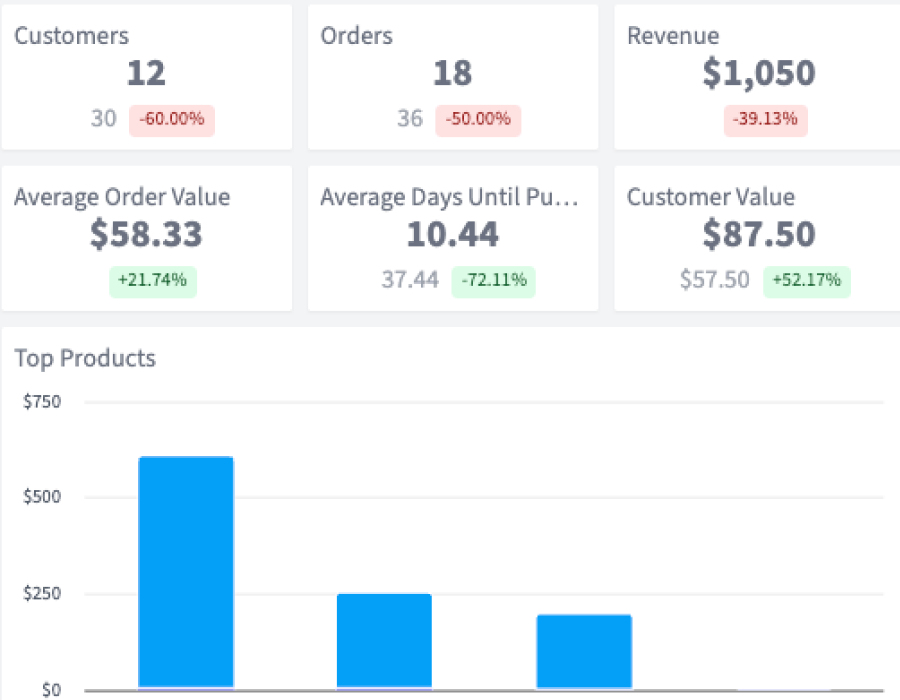
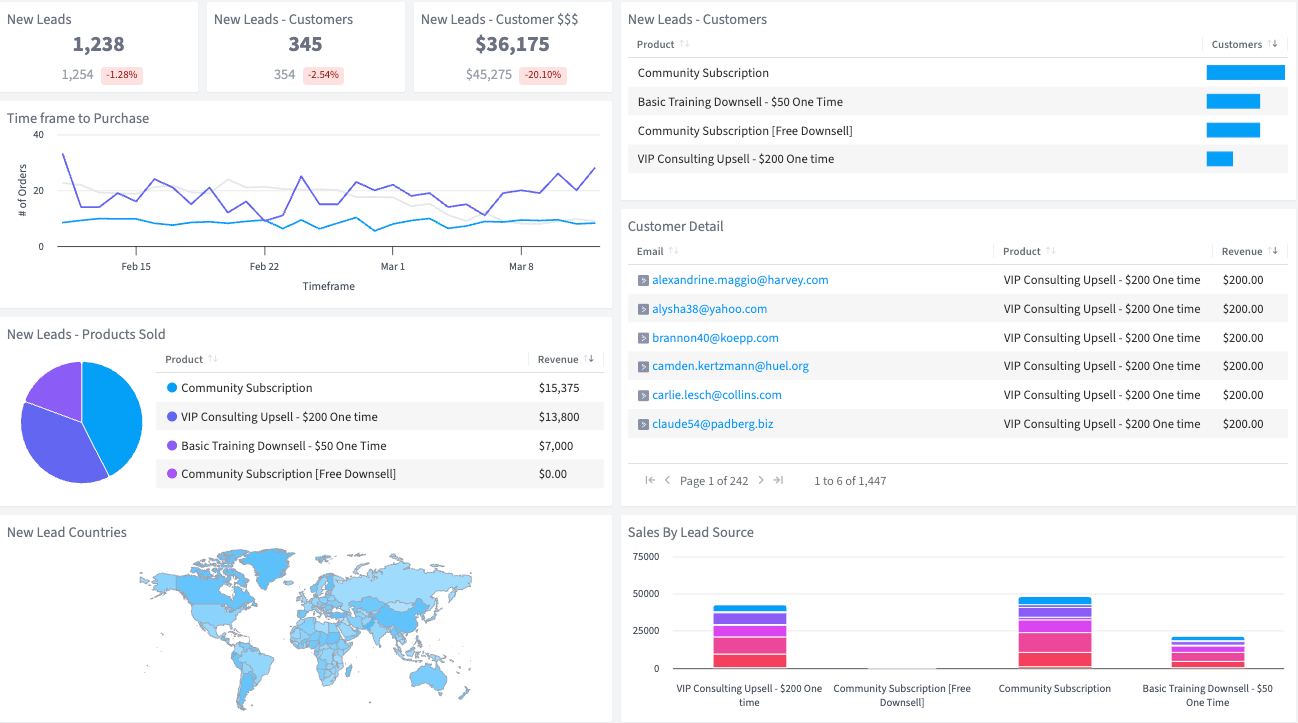
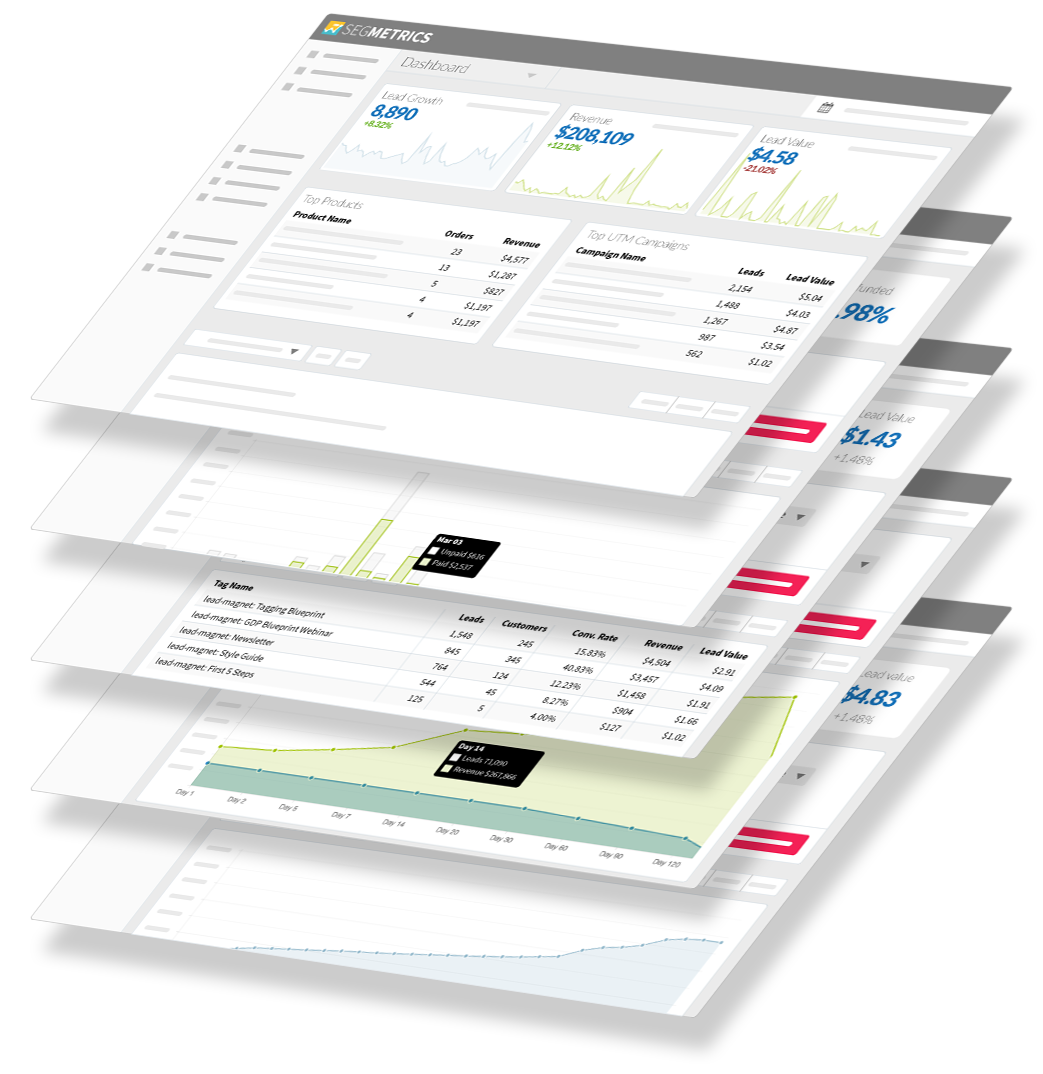
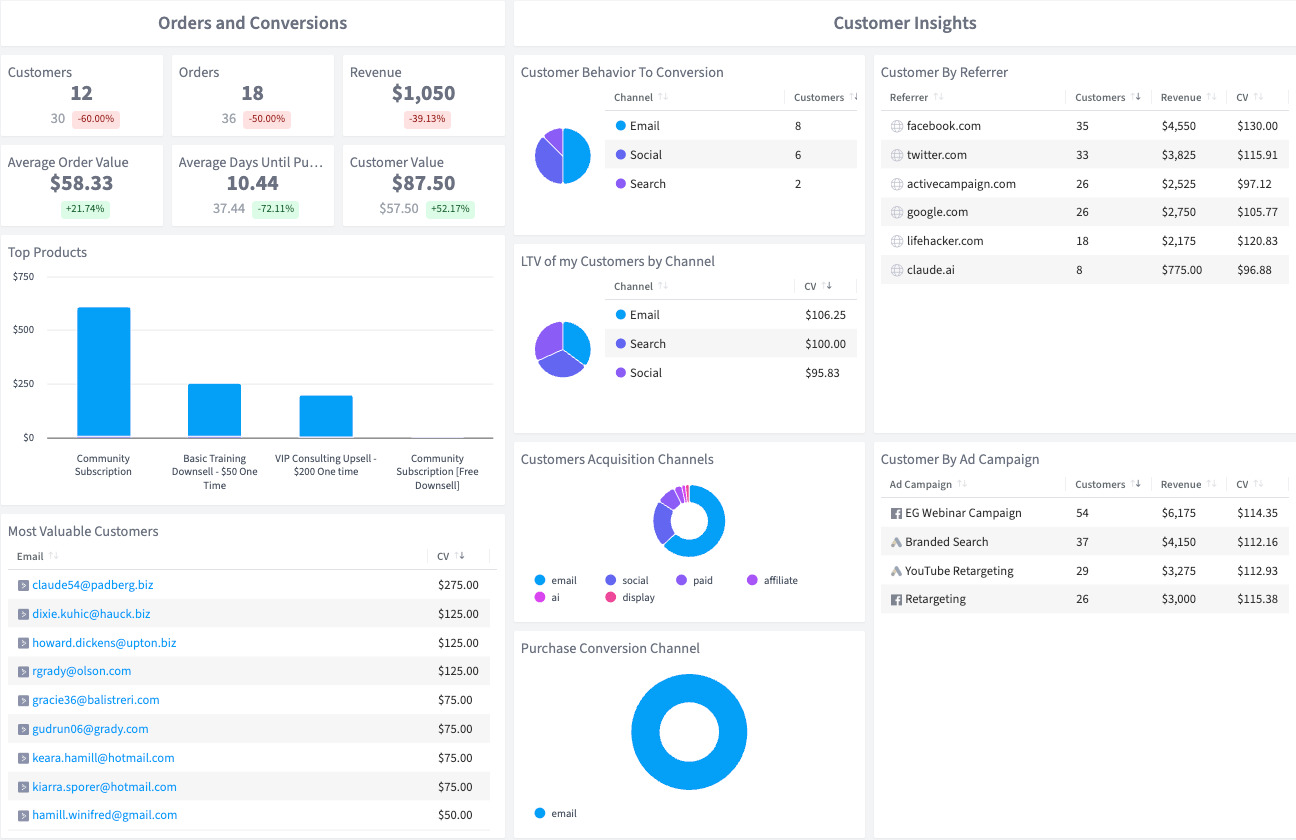
SegMetrics’ Conversion Overview Dashboard tracks your BOFU performance from a last-touch perspective. See who’s buying, what they’re spending, and which channels convert them at the bottom of the funnel. Monitor customer lifetime value, purchase frequency, average order value, and days until conversion — the metrics that matter for profitability.

The better you understand what converts your best customers, the faster you can grow.

Stop guessing about what drives revenue. Track it instantly with this dashboard.

Last Touch Attribution
Get clarity on what is actually driving customers to buy from you
Customer Value Insights
Track the levers critical to your growth: LTV, AOV, and repeat purchases
Sales Velocity
Monitor average days until purchase to understand your sales cycle
What's Included

The KPIs you get access to with this dashboard...

Customers
The total number of people who made a purchase during a specific time period
Orders
The total number of individual purchases or transactions completed
Revenue
The total amount of money generated from all sales during a specific time period
Average Order Value
The average dollar amount spent per transaction or purchase
Average Days Until Purchase
The average time it takes for a lead to become a paying customer
Customer Value
The average revenue generated by a customer across all their purchases
Top Products
A ranking of your best-selling products or services by revenue or units sold
Most Valuable Customers
A list of customers who have generated the highest total revenue or lifetime value
Customer Behavior to Conversion
The actions and engagement patterns customers take right before making a purchase
LTV of my Customers by Channel
The lifetime value of customers broken down by the marketing channel that drove their conversion
Customer Acquisition Channels
The marketing channels that bring in new customers to the business
Purchase Conversion Channel
The last-touch channel that directly led to a customer's purchase
Customer by Referrer
A breakdown showing which external websites or sources referred customers to you
Customer by Ad Campaign
A breakdown showing which specific ad campaigns drove customer conversions
Deep Dive

Inside the
Conversion Overview
Dashboard Template

Why this Dashboard
Why use the Conversion Overview Dashboard?

Everyone needs this dashboard. Whether you’re selling products, services, or subscriptions, you need to understand who’s actually buying and what drives them to convert.

This dashboard gives you bottom-of-funnel financial clarity. See your customers through a last-touch lens — which channels close the deal, what they purchase, how much they spend, and how long it takes them to buy. This intel informs everything: your messaging, your website, your ad strategy, and your product decisions.

Who it's for
This dashboard is perfect for:
  • Marketing teams that need to prove which channels drive actual revenue (not just traffic)
  • Business owners who want to understand their best customers and how to find more like them
  • E-commerce teams tracking purchase patterns, repeat buyers, and average order value
  • Anyone who needs BOFU performance metrics to make smarter growth decisions
What you can do
What can you do with this info?

Use this data to optimize your entire funnel for profitability, not just activity.

Start by evaluating whether you’re acquiring enough customers and if your average order value is where it needs to be. Dig into how long it takes leads to convert into buyers, and identify your top customers and repeat purchasers. From there, pinpoint which channels bring back your most valuable customers and which products drive the most revenue.

How Often
How often should you use it?

Review weekly or monthly to track customer trends and conversion performance. Use it to guide marketing strategy and budget allocation.

Integrations needed
What integrations do you need to use this dashboard?

The Conversion Overview Dashboard requires your CRM and payment processor. For channel attribution, connect your ad platforms. See our full list of integrations.

More ready-to-use dashboard templates

How SegMetrics Works

You have questions.
SegMetrics has answers.

When your data is fragmented across multiple tools, it’s hard to find answers to important questions about your marketing — like which ads bring in contacts with the highest LTV after 3, 6, and 12 months.

SegMetrics connects your data from all your marketing tools, including ad platforms, CRMs, email systems, payment processors and more. Find the hidden profits in your marketing.

Trusted by 3,000+ Marketers and Agencies

Squadcast Logo
Bixa Media Logo
Joanna Wiebe, CopyHackers

Joanna Wiebe

Founder, Copyhackers

“SegMetrics is perfect for digital training businesses like ours. Since switching to SegMetrics, we’ve been able to rely on our dashboard in ways we just couldn’t with ‘the other guys’.”

brandan dubbel

Brendan Dubbels

Senior Partner Manager, Ontraport

“It’s not enough for us to just track our ads right after the first click because someone may convert 6 months later. SegMetrics has made a huge difference in our ability to track what we are actually getting from our paid ads. We can even track the impact individual salespeople are having during the sales process.”

Eben Pagan

Founder, Eben Pagan Training

“SegMetrics gives you X-Ray vision to reveal what your customers are doing, how your marketing funnel is working… and how to make it work better.”

Discover the hidden
profits in your marketing

Start your 14-day free trial of SegMetrics today!