Template created by

Taboola Advertising

Prove the actual revenue impact of your Taboola native campaigns with downstream attribution.

4.7/5 based on 2,374 reviews | GDPR Compliant

X-ray vision for your Taboola advertising

Taboola will show you impressive click volumes and low CPCs on your native content discovery campaigns across major publisher sites.

But native advertising platforms like Taboola are notoriously difficult to measure. Their reporting covers clicks and basic conversions, but can’t connect those content discovery clicks to real revenue in your payment processor. And when you try to figure out if those readers became customers…well, the trail goes cold.

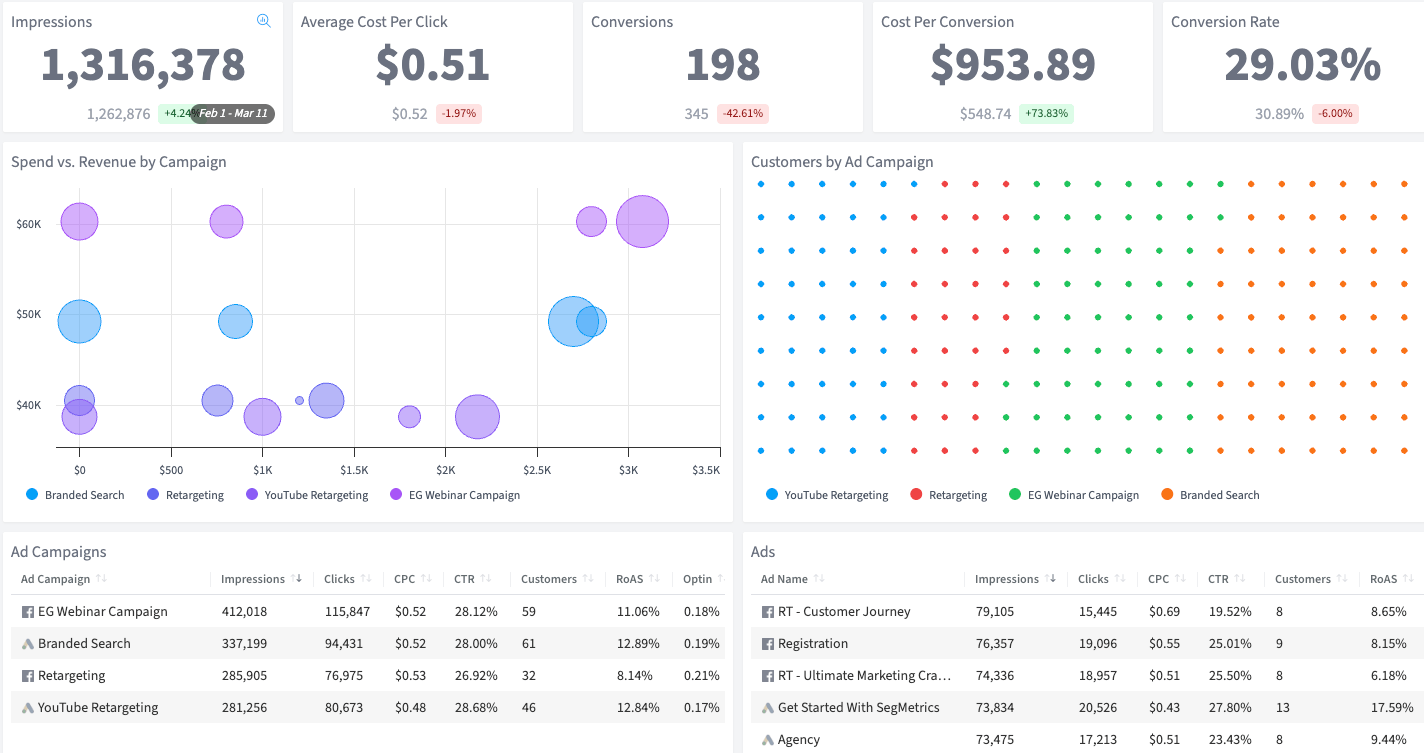
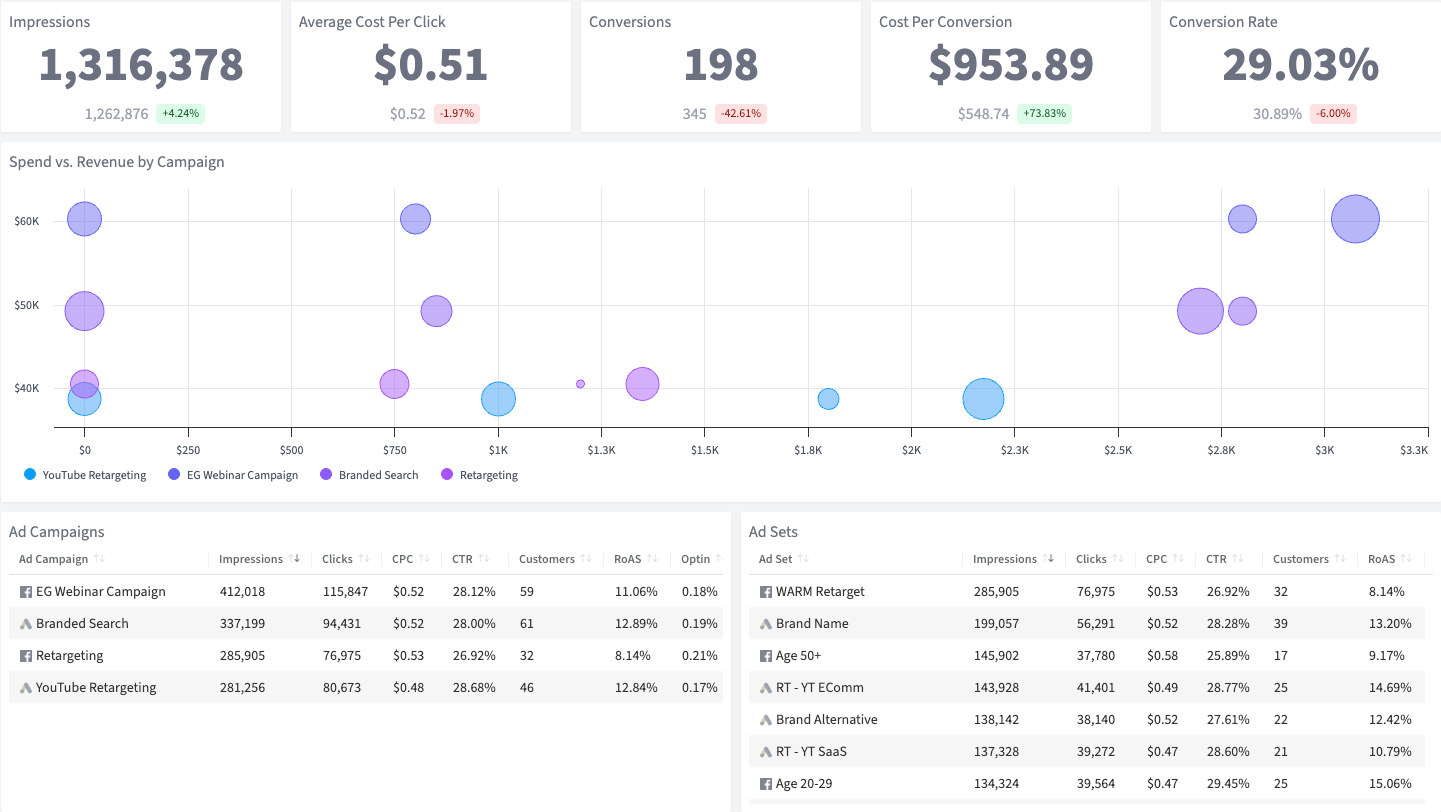
SegMetrics’ Taboola Advertising Dashboard solves this. Get all your critical ad metrics, including actual financials, with lifetime attribution. (Say goodbye to unmeasurable native ads!)

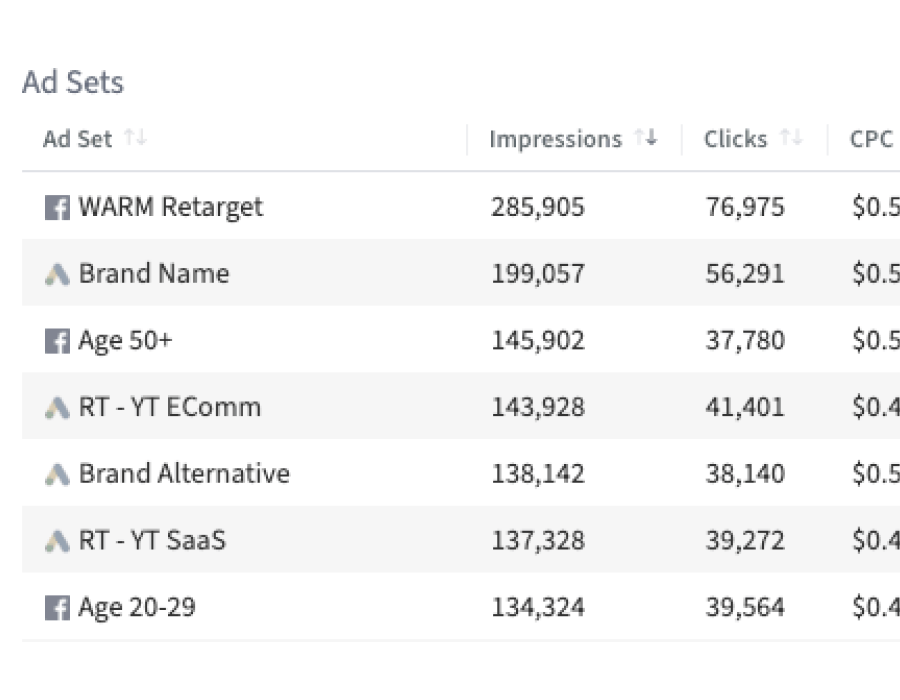
Everything you need, in one clean dashboard.

Ad Transparency
See your Taboola ad spend, revenue, ROAS, leads, customers, and CPA all in one view
Lifetime Attribution
Track actual conversions beyond Taboola's limited native ad attribution
Client-Ready Reporting
Clean, easy-to-read visualizations perfect for presenting to clients or management
What's Included

The KPIs you get access to with this dashboard...

Ad Spend Timeline
The total amount spent on Taboola ads over time
Revenue from Ad Spend
The total revenue generated from customers acquired through Taboola ads
ROAS
Return on ad spend — the ratio of revenue generated to ad dollars spent
Leads
The total number of leads generated from Taboola ad campaigns
Campaign Detail
A daily breakdown of ad spend, ad clicks, and revenue
Ad Detail
A daily breakdown of ad spend, ad clicks, and customers
Revenue by Date & Campaign
A timeline view showing revenue generated by each campaign over time
Leads from Ads
The number of leads acquired through Taboola advertising
Customers from Ad Spend
The number of customers acquired through Taboola ad campaigns
Orders from Ad Spend
The total number of orders placed by customers from Taboola ads
Average Order Value
The average dollar amount spent per order from Taboola ad customers
Revenue
The total revenue generated from all Taboola ad campaigns
Lead to Customer %
The percentage of Taboola-generated leads who became paying customers
Cost per Acquisition
The average cost to acquire a new lead through Taboola advertising
Cost per Customer
The average cost to acquire a paying customer through Taboola advertising
Deep Dive

Inside the
Taboola Advertising
Dashboard Template

Why this Dashboard
Why use the Taboola Advertising Dashboard?

Taboola’s native content discovery network places your ads on premium publisher sites, generating high click volumes at low costs. But native advertising is one of the hardest channels to attribute. Taboola’s reporting shows clicks and basic conversions, not whether that traffic turned into real revenue.

SegMetrics’ Taboola Advertising Dashboard connects your native campaign spend to verified revenue, so you can finally measure the true ROI of content discovery advertising.

Who it's for
This dashboard is perfect for:
  • Content marketers running Taboola native campaigns to drive traffic and leads
  • Performance marketers who need to prove that content discovery clicks turn into real revenue
  • Agencies managing Taboola alongside other ad platforms and needing apples-to-apples revenue comparisons
  • Anyone running native advertising who wants to see past cheap clicks and understand actual customer value
What you can do
What can you do with this info?

Find out if your Taboola native campaigns are generating real customers or just low-quality traffic. Go beyond click-based metrics and see the complete revenue journey from content discovery to purchase. Determine whether native advertising belongs in your media mix.

How Often
How often should you use it?

Review this dashboard weekly to monitor campaign performance and optimize ad spend in real time.

Integrations needed
What integrations do you need to use this dashboard?

The Taboola Advertising Dashboard requires Taboola integration, your CRM, the SegMetrics tracking pixel, and your payment processor. See our full list of integrations.

More ready-to-use dashboard templates

Facebook Advertising

Connect your Facebook ad spend to real pipeline revenue and stop guessing which campaigns work.

How SegMetrics Works

You have questions.
SegMetrics has answers.

When your data is fragmented across multiple tools, it’s hard to find answers to important questions about your marketing — like which ads bring in contacts with the highest LTV after 3, 6, and 12 months.

SegMetrics connects your data from all your marketing tools, including ad platforms, CRMs, email systems, payment processors and more. Find the hidden profits in your marketing.

Trusted by 3,000+ Marketers and Agencies

Squadcast Logo
Bixa Media Logo
Joanna Wiebe, CopyHackers

Joanna Wiebe

Founder, Copyhackers

“SegMetrics is perfect for digital training businesses like ours. Since switching to SegMetrics, we’ve been able to rely on our dashboard in ways we just couldn’t with ‘the other guys’.”

brandan dubbel

Brendan Dubbels

Senior Partner Manager, Ontraport

“It’s not enough for us to just track our ads right after the first click because someone may convert 6 months later. SegMetrics has made a huge difference in our ability to track what we are actually getting from our paid ads. We can even track the impact individual salespeople are having during the sales process.”

Eben Pagan

Founder, Eben Pagan Training

“SegMetrics gives you X-Ray vision to reveal what your customers are doing, how your marketing funnel is working… and how to make it work better.”

Discover the hidden
profits in your marketing

Start your 14-day free trial of SegMetrics today!