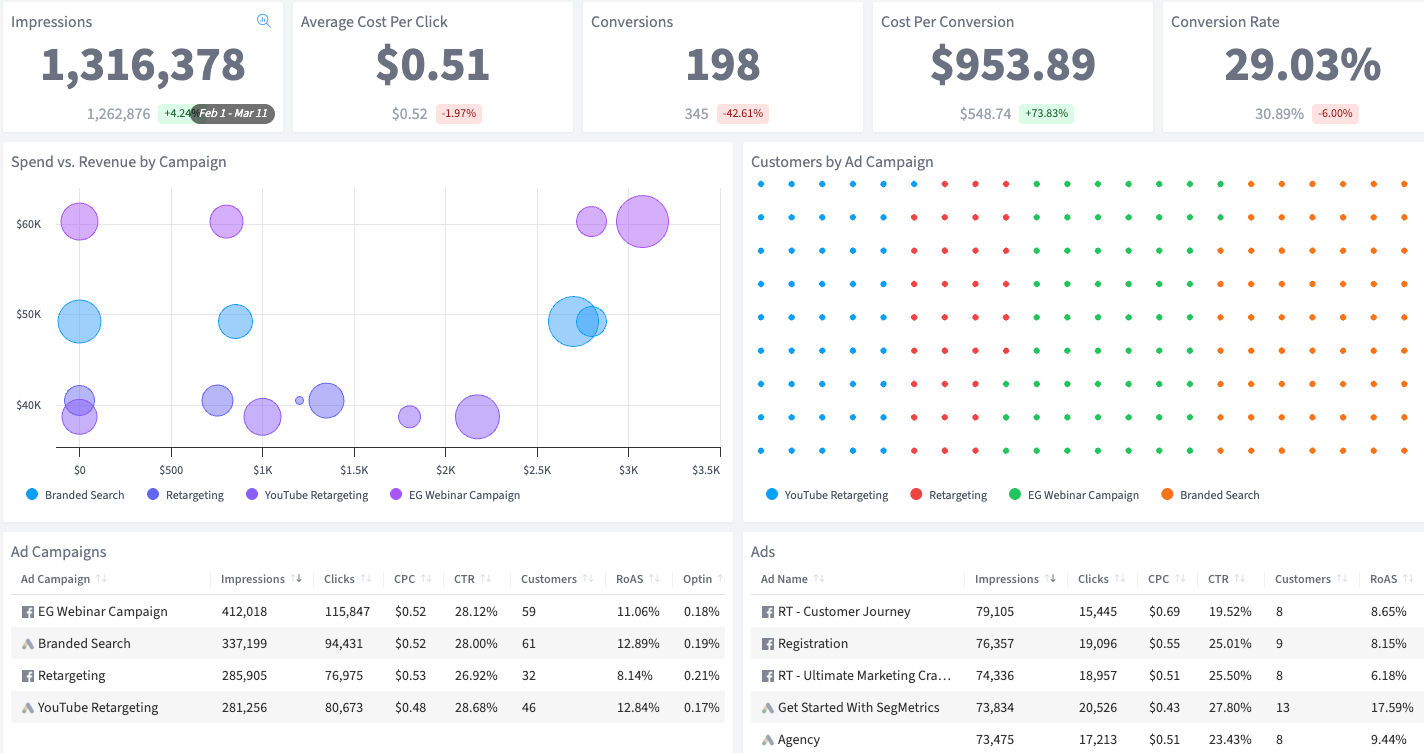
Impressions
The number of times your ads were displayed to users across your ad platforms

Drill into lifetime ad performance across every campaign, ad set, and individual creative.
This dashboard template is an MRI for your ad account.
Surface-level dashboards show symptoms. This one shows root causes. See which of your ad campaigns are healthy, which ad sets need attention, and which individual ads are gold mines, busywork, or liabilities.
SegMetrics’ Ad Campaign Performance Deep Dive Dashboard peels back every layer. Track everything from impressions to revenue at the most granular level possible — then use that intel to make surgical improvements.
Great ad performance isn’t about spending more. It’s about knowing exactly what’s working. Stop optimizing blind.
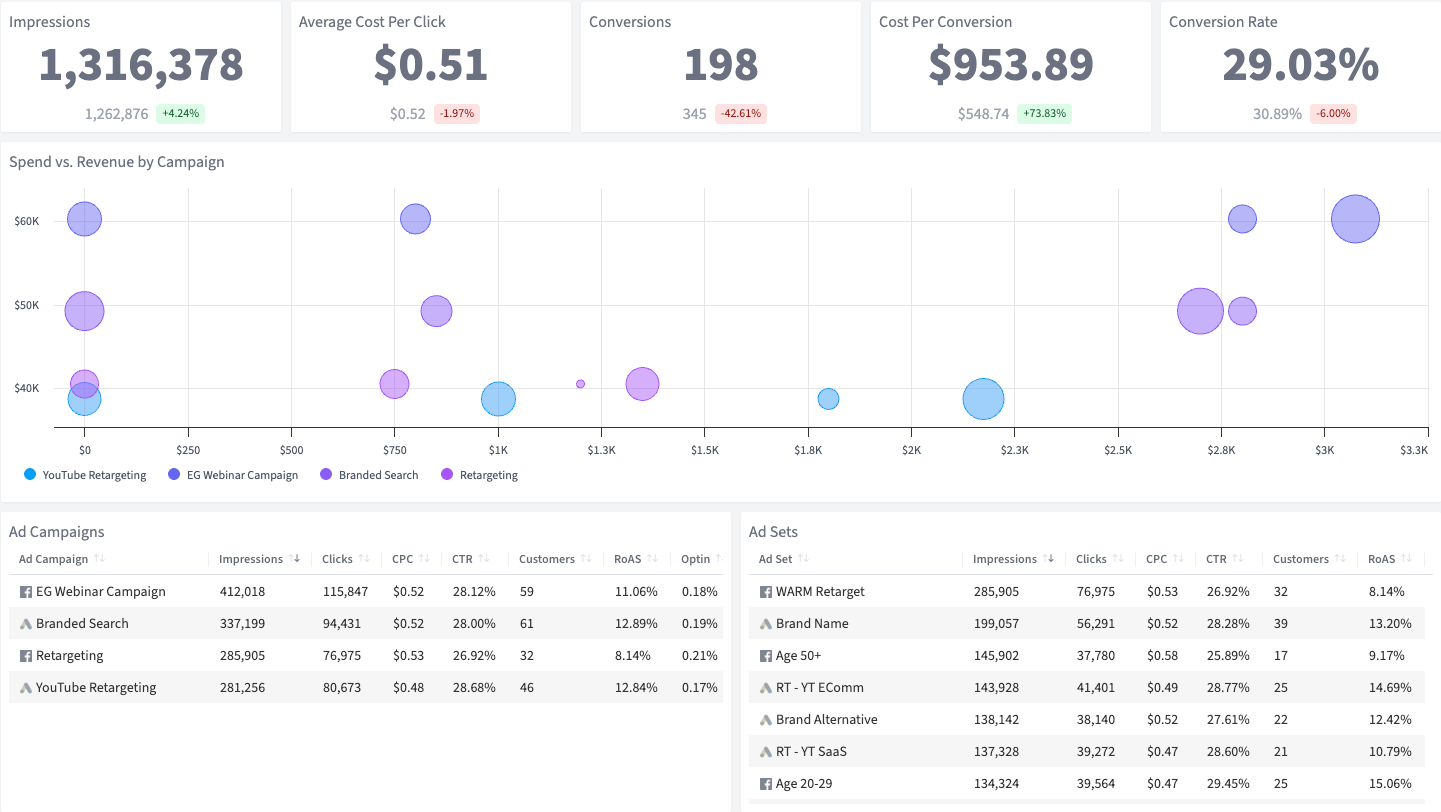
The number of times your ads were displayed to users across your ad platforms
The average amount you pay each time someone clicks on one of your ads
The number of people who took a desired action (like becoming a lead) after clicking your ad
The average amount you spend to acquire one conversion from your ad campaigns
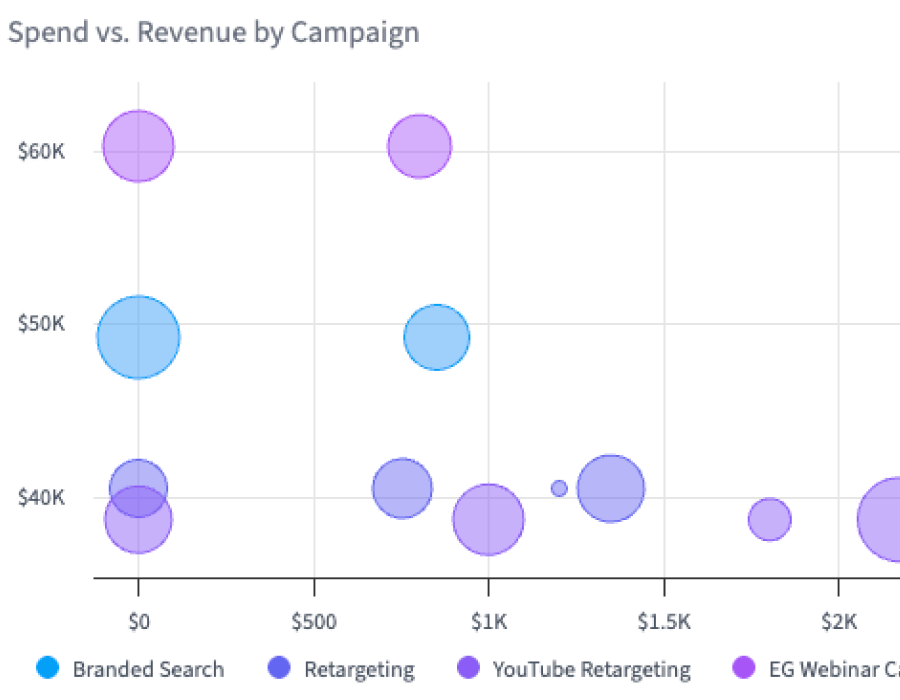
A comparison of how much you spent on each campaign versus the revenue it generated
The number of customers acquired through each campaign, showing true bottom-line impact
Performance breakdown of your individual advertising campaigns across platforms
Performance data for the ad sets within each campaign, showing granular results
Performance metrics for every individual ad creative, showing which specific ads drive results
Why this Dashboard
Most ad platforms give you campaign-level data. Some let you see ad sets. But if you want to know which specific ads are driving results — or draining your budget — you’re stuck doing manual detective work.
This dashboard solves this with lifetime performance visibility at every level: campaign, ad set, and individual ad.
Who it's for
What you can do
This isn’t just reporting. It’s actionable insights to make smarter decisions about your ad spend. Drill into any campaign to see which ad sets are driving conversions and revenue. Identify your best-performing creative and double down on it. Spot underperformers early and cut them before they waste more budget. Track customer acquisition by campaign to understand true ROI.
How Often
Check this dashboard weekly to review ad performance and identify optimization opportunities. Use it during campaign reviews to make data-driven decisions about creative and targeting.
Integrations needed
The Ad Campaign Performance Deep Dive Dashboard requires connections to your ad platforms (Facebook, Google, etc.) and your CRM. The SegMetrics tracking pixel is also required. See our full list of integrations.
See all of our 100+ pre-built dashboards
Go beyond clicks — see which campaigns are converting real leads in your CRM.
Analyze every Microsoft Ads campaign, ad group, and keyword with lifetime performance data.
Break down performance for every Twitter campaign, ad group, and Promoted Tweet over their full lifetime.
How SegMetrics Works
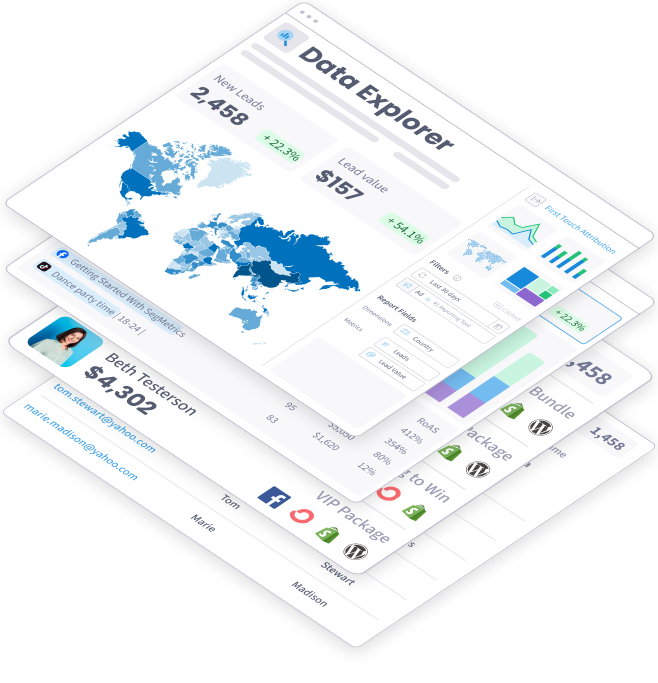
When your data is fragmented across multiple tools, it’s hard to find answers to important questions about your marketing — like which ads bring in contacts with the highest LTV after 3, 6, and 12 months.
SegMetrics connects your data from all your marketing tools, including ad platforms, CRMs, email systems, payment processors and more. Find the hidden profits in your marketing.
Trusted by 3,000+ Marketers and Agencies











“Since switching to SegMetrics, we’ve been able to rely on our dashboard in ways we just couldn’t with 'the other guys’.”


“It’s not enough for us to just track our ads right after the first click because someone may convert 6 months later. SegMetrics has made a huge difference in our ability to track what we are actually getting from our paid ads. We can even track the impact individual salespeople are having during the sales process.”


“SegMetrics gives you X-Ray vision to reveal what your customers are doing, how your marketing funnel is working...”

Start your 14-day free trial of SegMetrics today!