Webinar Funnel Stages
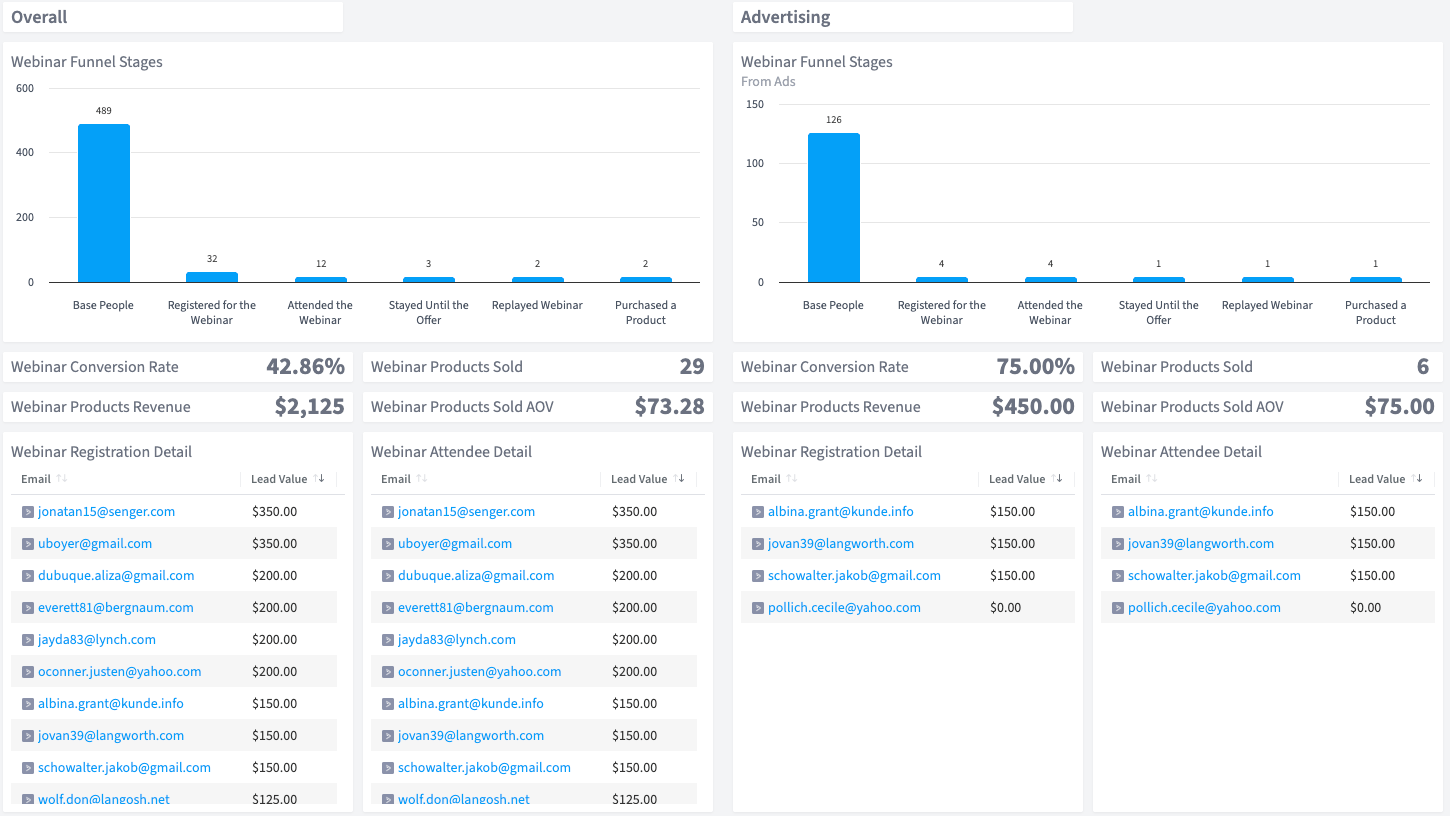
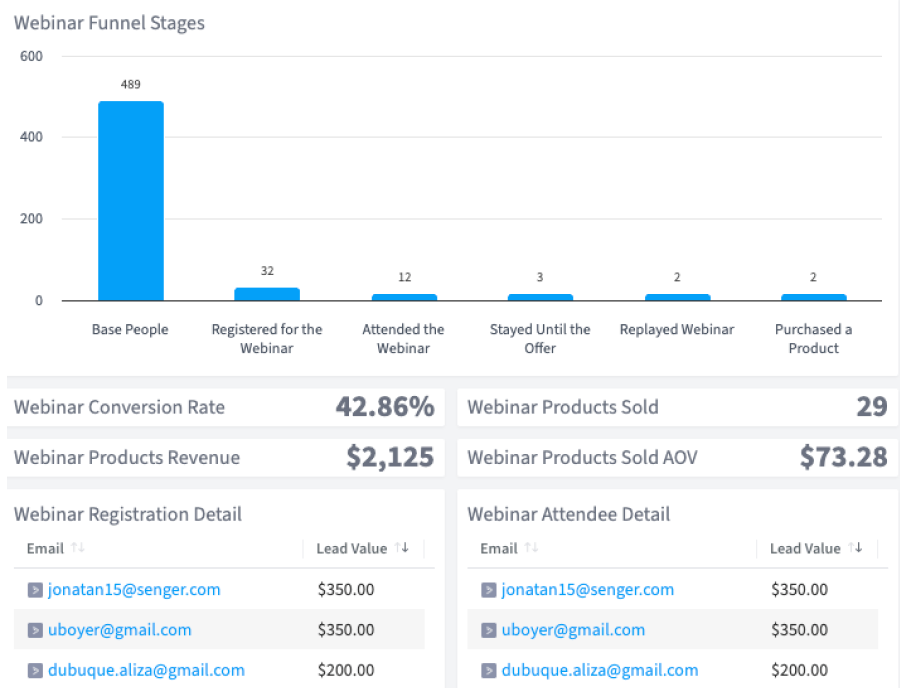
A visualization of the number of people at each stage in your webinar funnel

Follow your Demio funnel from registration to revenue and find where leads convert or drop off.
Demio makes it easy to run browser-based webinars with no downloads — but tracking the full funnel from registration to revenue? That’s where things get complicated.
Demio’s analytics show registrations and attendance, but don’t connect the dots to sales data. Where is your funnel leaking? Which traffic sources bring buyers, not just registrants?
SegMetrics’ Demio Funnel Dashboard solves this. See every stage of your Demio funnel — from registration through attendance to purchase. Compare overall performance against paid ads. Identify the exact drop-off points costing you revenue.
No other tool offers a Demio funnel dashboard like this. Only SegMetrics.
A visualization of the number of people at each stage in your webinar funnel
The percentage of webinar registrants who became paying customers
The total number of products sold through the webinar funnel
The total revenue generated from all webinar product sales
The average order value of products purchased through the webinar funnel
A list of individual registrants with their email addresses and lead values
A list of individual attendees with their email addresses and lead values
Why this Dashboard
Demio is built for marketers — browser-based, clean UX, no downloads. But its reporting stops at the webinar itself. It won’t tell you which registrants became customers, what your true cost per acquisition is, or where your funnel breaks down between attendance and purchase.
SegMetrics’ Demio Funnel Dashboard fills the gap. Connect your Demio data to your CRM and ad platforms, and finally see the full picture in one place.
Who it's for
What you can do
Find the leaks in your Demio funnel. If you have a low registration-to-attendance rate, your reminder sequence needs work. If attendance is high but people leave before the offer, there’s a message disconnect. If lots of people stay until the end but few buy, your offer or pricing expectations aren’t aligned.
Optimizing your Demio webinars starts with getting a single source of truth for your full webinar funnel.
How Often
Review this dashboard after each Demio webinar. If you run recurring or scheduled sessions, review it weekly to spot trends and optimization opportunities.
Integrations needed
The Demio Funnel Dashboard requires your webinar platform (Demio), your CRM, and optionally your ad platforms for paid traffic tracking. See our full list of integrations.
See all of our 100+ pre-built dashboards
Track your entire webinar funnel from registration to revenue in one place.
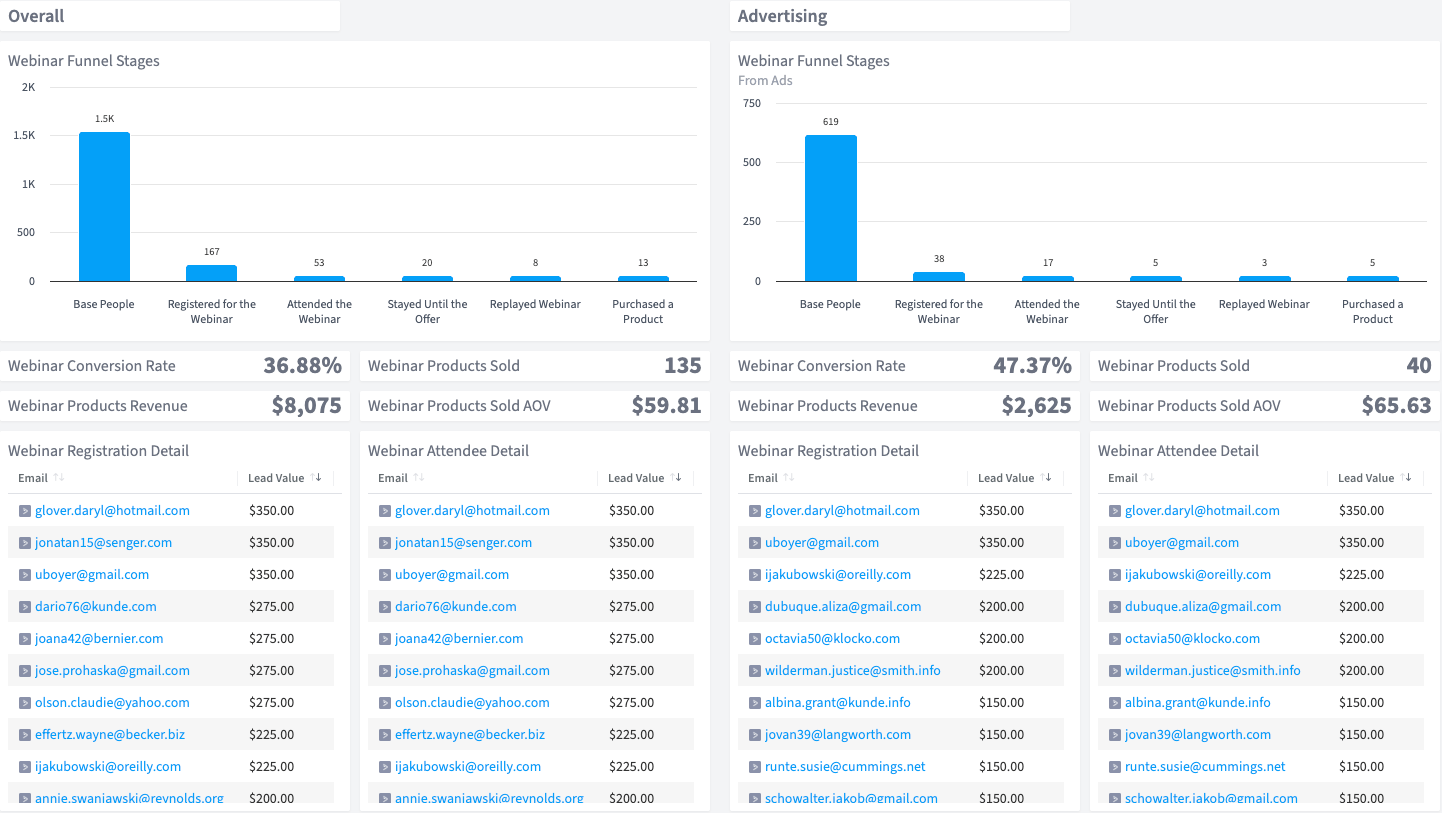
Connect WebinarJam attendance data to real revenue and see where attendees drop off.
Track your WebinarNinja funnel end to end — from registration to revenue — in one dashboard.
This dashboard reads straight from the integration below. Connect it once and the template fills itself in.
How SegMetrics Works
When your data is fragmented across multiple tools, it’s hard to find answers to important questions about your marketing — like which ads bring in contacts with the highest LTV after 3, 6, and 12 months.
SegMetrics connects your data from all your marketing tools, including ad platforms, CRMs, email systems, payment processors and more. Find the hidden profits in your marketing.
Trusted by 3,000+ Marketers and Agencies










Since switching to SegMetrics, we’ve been able to rely on our dashboard in ways we just couldn’t with 'the other guys’.


It’s not enough for us to just track our ads right after the first click because someone may convert 6 months later. SegMetrics has made a huge difference in our ability to track what we are actually getting from our paid ads. We can even track the impact individual salespeople are having during the sales process.


SegMetrics gives you X-Ray vision to reveal what your customers are doing, how your marketing funnel is working...

Start your 14-day free trial of SegMetrics today!
