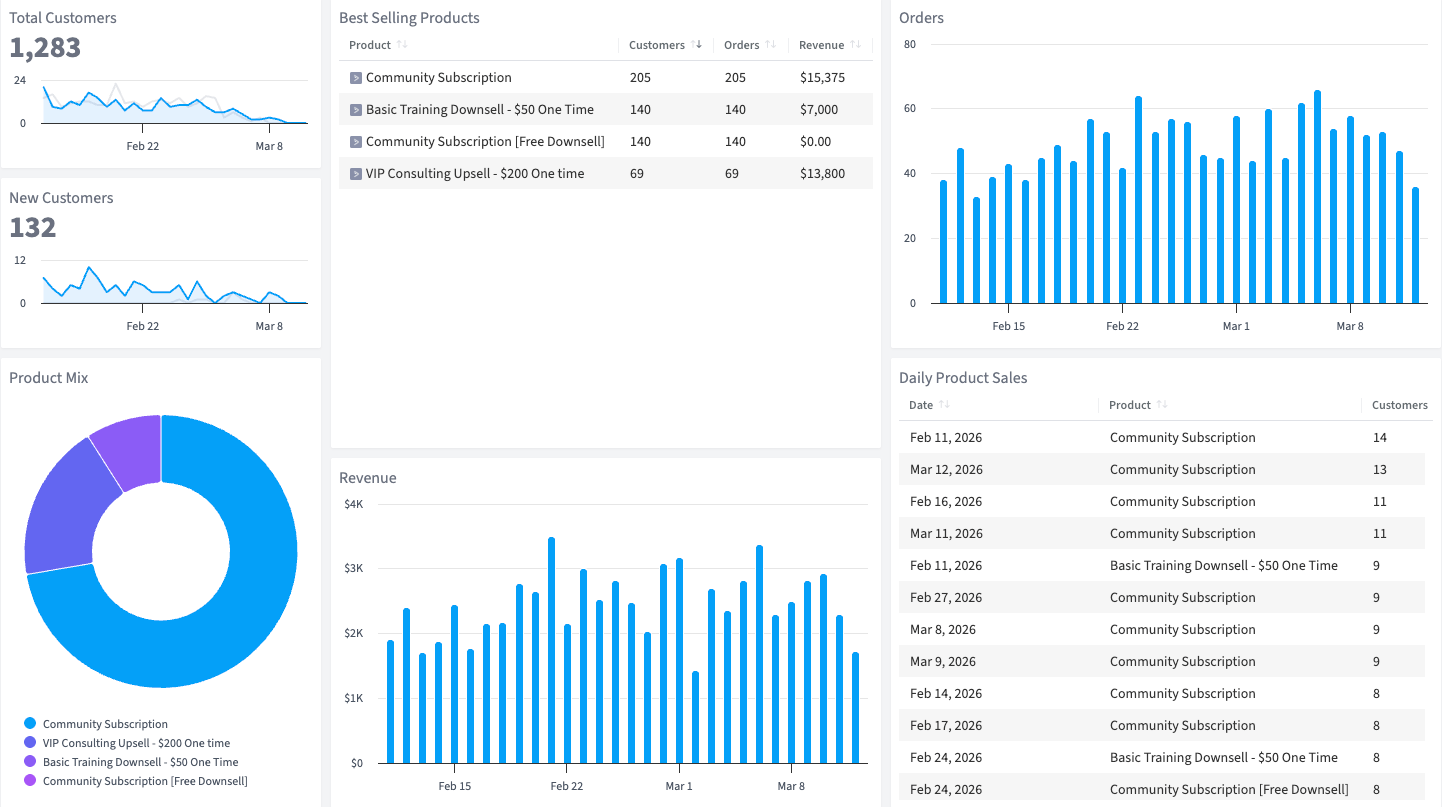
Total Customers
The total number of customers who have made purchases from your Thinkific school

Monitor Thinkific course sales, enrollment trends, and revenue growth at a glance.
Thinkific delivers your courses. This dashboard delivers your insights.
Get the essential data on your total customers, new customers, daily orders, and daily revenue all in one place. See breakdowns by product and tag, and monitor your product mix across courses, communities, and digital learning products.
SegMetrics’ Thinkific Course Sales Performance Dashboard is built for course creators and educators using Thinkific who need fast, unified sales insights without wading through Thinkific’s native analytics. (Plus, SegMetrics lets you see names, emails, and customer journeys behind every metric.)
See what clearer data can do for your Thinkific business.
The total number of customers who have made purchases from your Thinkific school
The number of first-time customers who made their first purchase during a specific time period
A breakdown of the distribution of sales across your different products
The total revenue generated from all Thinkific sales during a specific time period
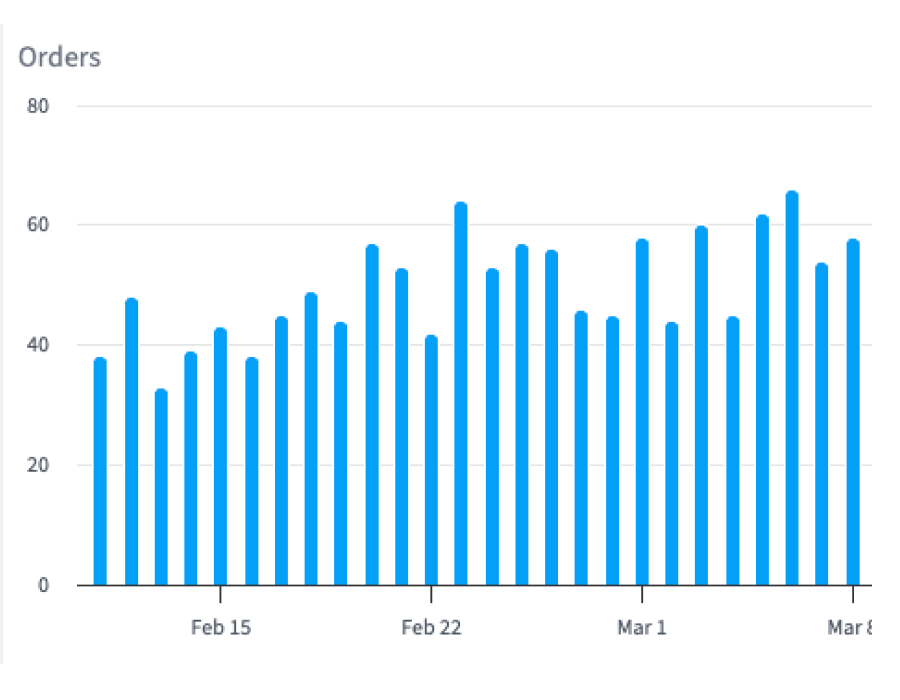
The total number of orders placed through your Thinkific school during a specific time period
A ranking of your top-performing products by customers, orders, and revenue
Total sales broken down by CRM tags for segmented performance tracking
Why this Dashboard
Thinkific is a leading platform for online courses and digital learning communities, but its native analytics don’t always tell the full story. SegMetrics’ Thinkific Course Sales Performance Dashboard gives you a consolidated, actionable view of your sales performance across all your offers.
Don’t settle for basic enrollment counts. Get the metrics you need, when you need them, and scale your digital education business.
Who it's for
What you can do
Monitor your Thinkific sales health at a glance. Identify red flags in your course and community revenue instantly, especially when you use Metric Alerts with this sales data.
How Often
Review this dashboard daily or weekly, depending on the speed and size of your business. Definitely daily if you’re running a major launch or promotion.
Integrations needed
The Thinkific Course Sales Performance Dashboard requires your Thinkific integration and optionally your CRM if you’re using one alongside Thinkific. See our full list of integrations.
See all of our 100+ pre-built dashboards
Track Kajabi course enrollments, revenue, and student acquisition in one place.
See which Teachable courses drive the most revenue and where students come from.
See your ClickBank sales, refund rates, and product performance in one organized view.
This dashboard reads straight from the integration below. Connect it once and the template fills itself in.
How SegMetrics Works
When your data is fragmented across multiple tools, it’s hard to find answers to important questions about your marketing — like which ads bring in contacts with the highest LTV after 3, 6, and 12 months.
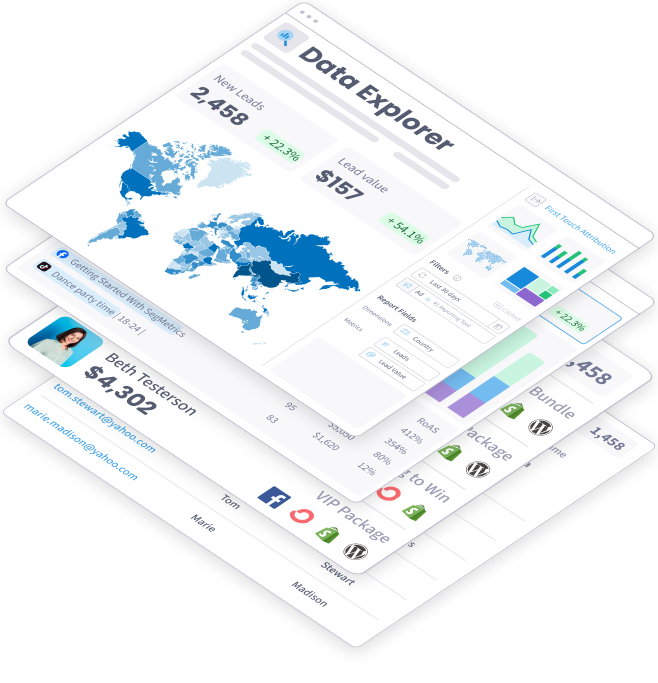
SegMetrics connects your data from all your marketing tools, including ad platforms, CRMs, email systems, payment processors and more. Find the hidden profits in your marketing.
Trusted by 3,000+ Marketers and Agencies









Since switching to SegMetrics, we’ve been able to rely on our dashboard in ways we just couldn’t with 'the other guys’.


It’s not enough for us to just track our ads right after the first click because someone may convert 6 months later. SegMetrics has made a huge difference in our ability to track what we are actually getting from our paid ads. We can even track the impact individual salespeople are having during the sales process.


SegMetrics gives you X-Ray vision to reveal what your customers are doing, how your marketing funnel is working...

Start your 14-day free trial of SegMetrics today!
