New Deals
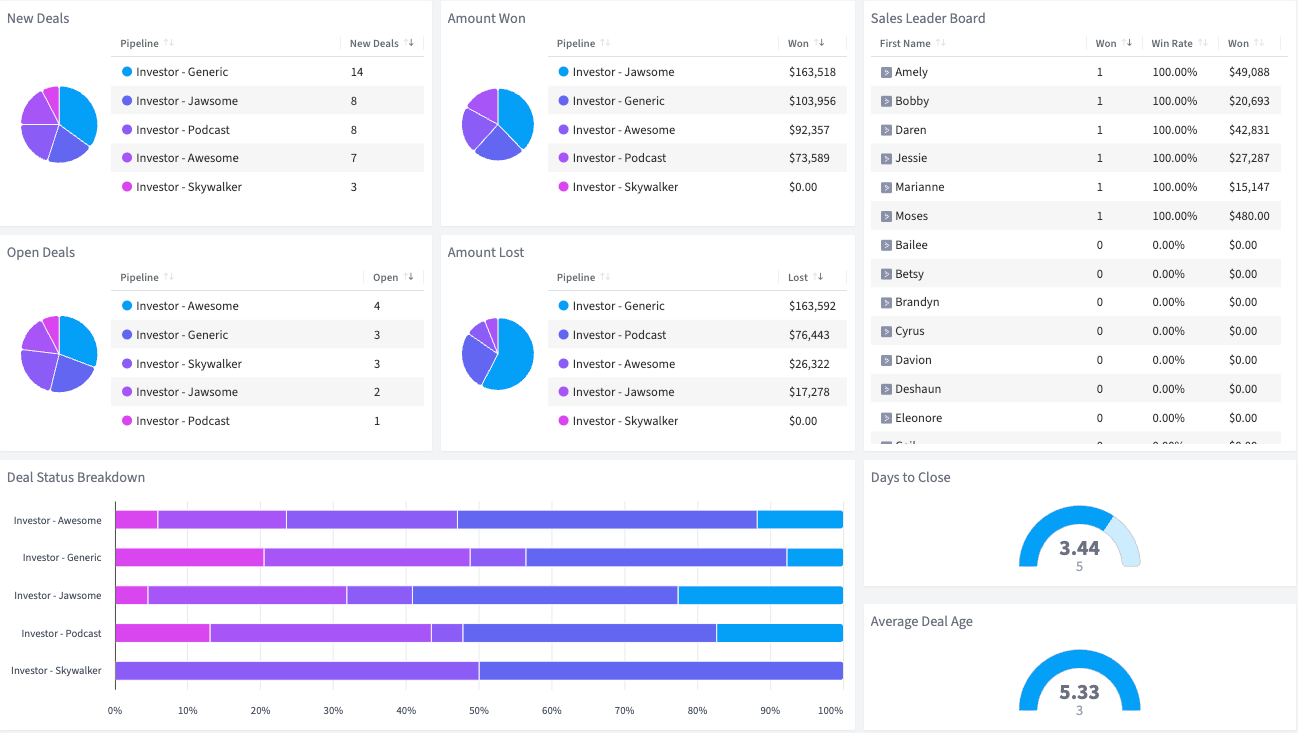
The number of deals created in your pipeline during a specific time period

See exactly where deals stand in your Ontraport pipeline and how fast they move to close.
Ontraport combines CRM, email marketing, payments, and deal management into one platform — but when it comes to pipeline analytics, Ontraport’s reporting tools leave gaps that matter.
SegMetrics’ Ontraport Deal Pipeline Dashboard gives you the visibility Ontraport’s native deal cards don’t. See which deals are progressing, which are sitting idle, and where your highest-value opportunities are hiding — without wrestling with custom reporting or exporting to spreadsheets.
Whether you’re a business owner managing your own deals or a team tracking sales alongside Ontraport’s automation workflows, this dashboard delivers instant pipeline clarity.
Less manual tracking, more deal flow intelligence.
The number of deals created in your pipeline during a specific time period
Deals currently in progress that have not yet been marked as won or lost
The total revenue from deals successfully closed during a selected time period
The total value of deals that did not close successfully during a selected time period
A percentage overview of deals categorized by deal stage
A ranking of sales reps by performance metrics like revenue, win rate, and deals closed
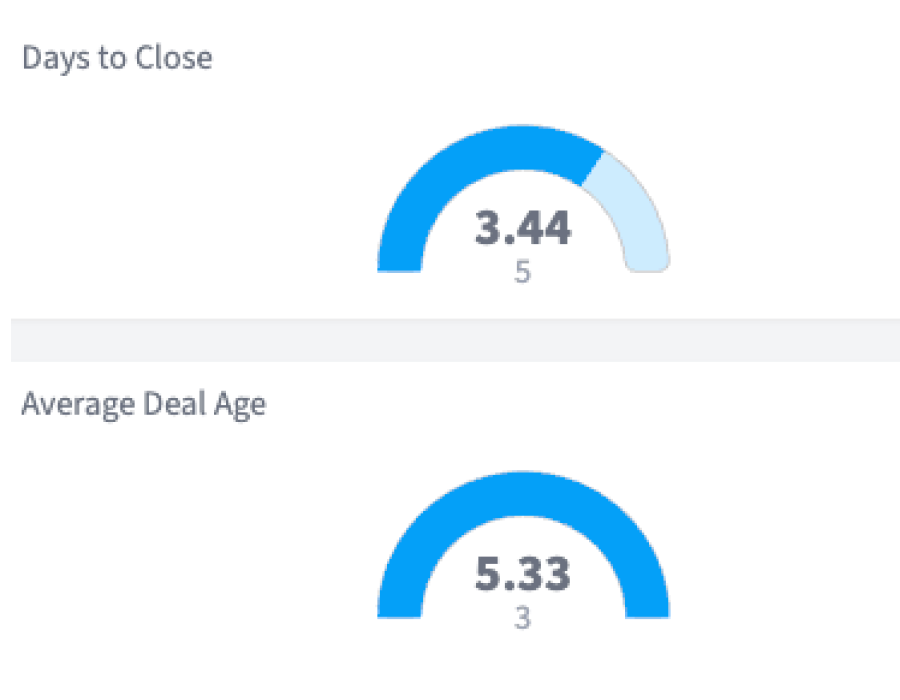
The average number of days from deal creation to closed-won or closed-lost
The average time a deal has been open in your pipeline, measured from creation date
Why this Dashboard
Ontraport gives you CRM, email, payments, and deal management in one platform — but its pipeline reporting is limited. Getting metrics like deal velocity, win rates by rep, or average days to close means building custom reports or piecing together data across Ontraport’s different tools. If you’re managing deals alongside Ontraport’s automations and payment processing, you need a clearer view of what’s happening in your pipeline. This dashboard delivers that instantly.
Who it's for
What you can do
See your deal flow at a glance: new deals, open deals, closed-won, and closed-lost. Track how long deals stay open and how quickly they move from one stage to the next. Identify your top performers with sales leaderboards, and spot underperformers before small problems become big ones.
In short, get the data you need to start making data-driven decisions about your deal pipeline.
How Often
We recommend you check your Deal Pipeline Dashboard weekly to monitor your pipeline health. Use the leaderboard to motivate and coach your team. Watch your average days to close. If that number creeps up, it’s a sign deals are stalling and need attention.
Integrations needed
The Ontraport Deal Pipeline Dashboard requires your Ontraport integration connected to SegMetrics. See our full list of integrations.
See all of our 100+ pre-built dashboards
Monitor Pipedrive deals through every stage and spot bottlenecks before they cost you revenue.
Get instant clarity on your Attio pipeline — deal progression, conversion rates, and projected revenue.
Track Keap deals from lead to close with clear stage-by-stage performance data.
This dashboard reads straight from the integration below. Connect it once and the template fills itself in.
How SegMetrics Works
When your data is fragmented across multiple tools, it’s hard to find answers to important questions about your marketing — like which ads bring in contacts with the highest LTV after 3, 6, and 12 months.
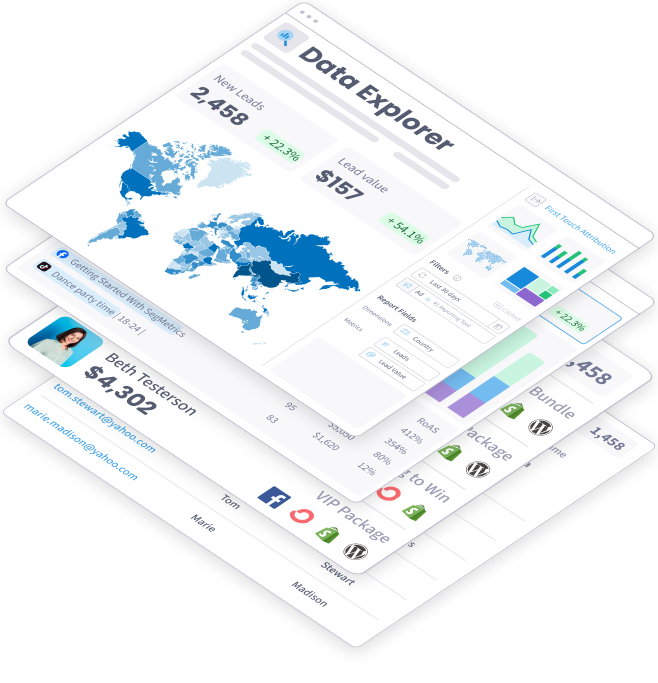
SegMetrics connects your data from all your marketing tools, including ad platforms, CRMs, email systems, payment processors and more. Find the hidden profits in your marketing.
Trusted by 3,000+ Marketers and Agencies











“Since switching to SegMetrics, we’ve been able to rely on our dashboard in ways we just couldn’t with 'the other guys’.”


“It’s not enough for us to just track our ads right after the first click because someone may convert 6 months later. SegMetrics has made a huge difference in our ability to track what we are actually getting from our paid ads. We can even track the impact individual salespeople are having during the sales process.”


“SegMetrics gives you X-Ray vision to reveal what your customers are doing, how your marketing funnel is working...”

Start your 14-day free trial of SegMetrics today!
