

Many modern marketers have one rather comical problem: too much data. And it’s hardly surprising. Social media platforms, SEO tools, web analytics, CRMs… all of them produce tons of numbers.
And yet, does all that data actually help you improve your content strategy?
Not necessarily. And not always.
Without proper reporting, numbers stay exactly what they are. Just numbers. But good reporting turns those scattered analytics into insights, direction, clarity, and, most importantly, context. It helps you see what content really works, and what just “exists” there.
So, what should your content marketing report include? And what are the most important content marketing metrics to focus on? Let’s find all that out.
Why Do You Need Content Marketing Reporting?
To design some fancy charts and show them during your important meetings.
Well, at least it seems that way…
But jokes aside, effective content marketing reporting is the only way to understand what you have to do. And we aren’t exaggerating here. How can you improve and grow if you don’t know what results your actions are generating?
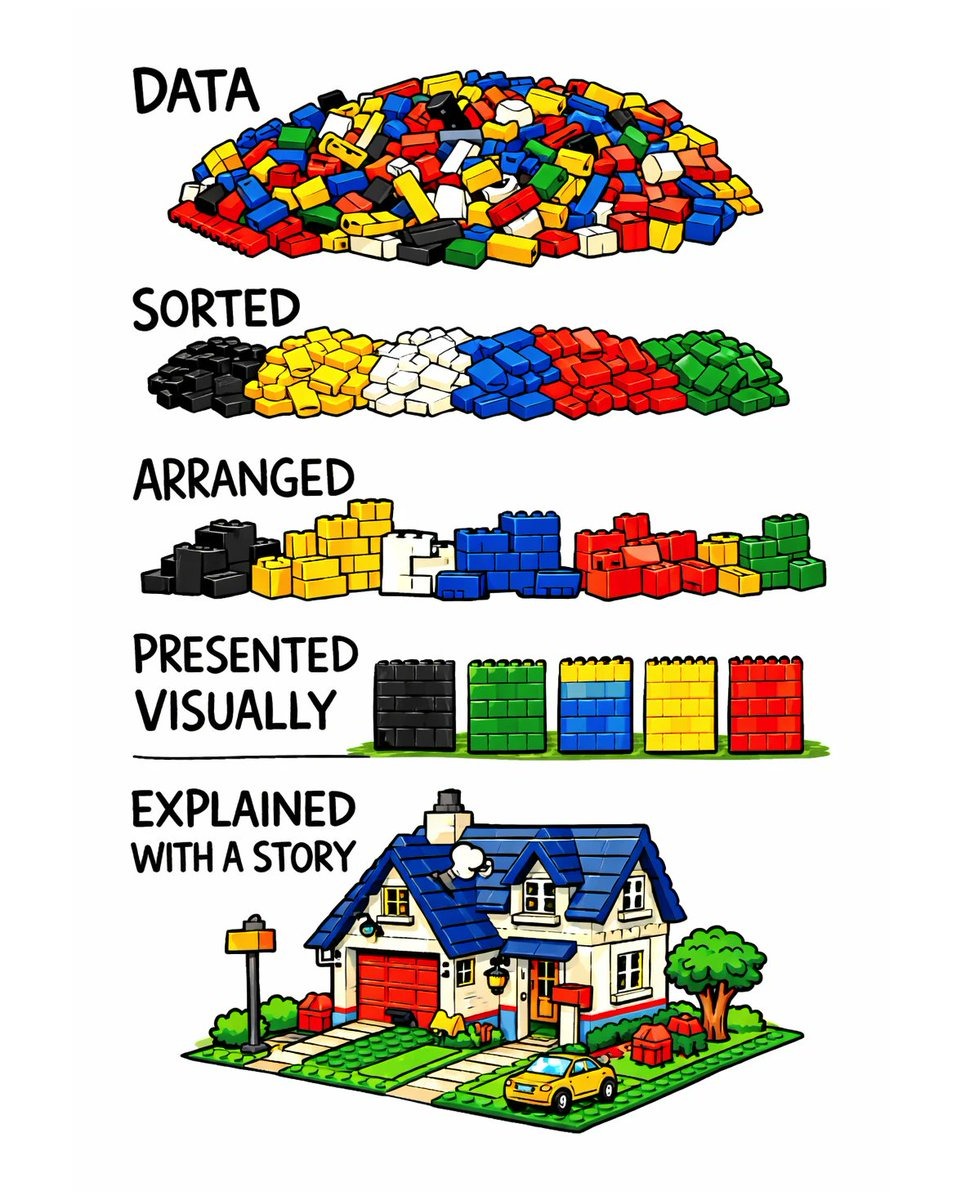
Reporting structures your data and helps you clearly see and understand what’s happening with your content.
This visual explains it all:
Source: X
A good content marketing report answers a few very important questions: “Is our content bringing in traffic?” “Are our readers actually engaging with it?” “Does this content help generate leads or revenue?” “Which topics and formats perform best?”
Without this analysis, all you can see is fragments. But if you want your content marketing to work, you need to track a bigger picture:
- Check performance over time,
- Identify what content drives results,
- Prove the ROI of your content activity.
Besides, your team needs this. Copywriters, SEO specialists, project managers, and stakeholders can see the same data and understand how content contributes to the bigger marketing strategy.
Key Content Marketing Metrics to Track
There are so many content-related metrics that it’s easy to get lost. But what actually deserves space in your report?
Traffic
Traffic is often the first signal that your content is visible. It basically shows how many people visit your content pages and where they come from.
To get a fuller picture, assess these metrics:
- Page views,
- Unique visitors,
- Traffic sources (organic, social, referral, direct).
To monitor traffic, most marketers rely on website analytics platforms. That could be Google Analytics or other paid analytics tools. Of course, traffic alone doesn’t mean success, but it helps you understand whether your content is being discovered at all.
Engagement
While traffic shows visibility, engagement is about interest and user experience, which is making things easier for your readers.
This is huge because if people land on your content but immediately leave, something isn’t working. And these metrics can help you notice that:
- Time on page and scroll depth,
- Bounce rate,
- Comments or other interactions (if available).
These numbers show you whether readers actually consume your content or just skim through it.
If the engagement is strong, it means you’ve hit the right spot, and something has value for your audience. You can analyze this further by using heatmaps, session recordings, and similar options.
SEO Performance
For many companies, organic search is the main source of long-term traffic. That means one thing: SEO metrics come into play.
The main SEO indicators you can use in your reporting are:
- Keyword rankings,
- Organic traffic growth,
- Backlinks earned naturally, etc.
These metrics reveal how well your content performs in search engines and whether your content marketing supports your SEO efforts.
Conversions
No matter how you look at it, content should support business goals. So, conversion metrics are sort of the “deciding factor” whether your content works to hit them.
Depending on your business model and current marketing strategies, conversions might include:
- Newsletter signups,
- Product trial/demo,
- Registrations,
- Downloads of any free content (reports, tutorials, etc.),
- Actual purchases (especially for BoFu content).
Tracking conversions helps you understand what content (messaging, formats, etc.) drives results. That’s where marketing attribution models can also help.
What Tools Do You Really Need?
You don’t need dozens of platforms to run effective content marketing reporting.
And while the actual stack will differ based on your size, channels, goals, niche, etc., most effective teams rely on tools that cover these three main areas.
Web Analytics Tools
Analytics platforms essentially track web traffic and audience interactions with your site. They help you check traffic, engagement, user journeys, conversions, etc.
Typical analytics tools that are effective are:
- Google Analytics,
- Analytics dashboards inside CMS platforms,
- Product analytics tools (if you’re a SaaS brand),
- E-commerce analytics platforms, etc.
With these, you can monitor most of the core content marketing metrics that we mentioned earlier.
SEO Tools
SEO performance and content marketing work best together. So, you’ll definitely need at least one SEO tool for content performance analytics, competitor insights, topic research, AI visibility improvement, and so on.
Some of the best and most popular SEO tools are Ahrefs, Semrush, and Moz. But if you need something more specific, you might want to discover additional software like:
- SurferSEO for on-page optimization,
- Screaming Frog for backlink analysis, etc.
Reporting and Dashboard Tools
And of course, to create SEO reports for your own brand or your clients, you need a solution that can speed up this whole process.
These days, many brands integrate AI agents here.
They basically combine data from different tools and analyze it to come up with some truly actionable insights. This could be an interesting thing to explore.
But even without AI agents, you don’t have to manually copy-paste numbers into spreadsheets every month, because there are several dashboards that can automate the process.
Some of the popular examples are:
- Google Looker Studio
- Tableau
- Power BI
- SegMetrics
How to Build a Content Marketing Report in 5 Steps
Creating a good report doesn’t require complicated frameworks. All you need is a good structure and consistency.
Here’s a simple 5-step process to make a content marketing report.
1. Figure Out Your Goals
Before collecting data, decide what your report should measure.
For example, brand awareness, SEO growth, lead generation, maybe something broader, like product education, particular feature integration, etc.
Your reporting should always reflect the main goals of your content strategy. Otherwise, you will create an unnecessary mess that will just waste your team’s time.
2. Select the Right Metrics
Once your objectives are clear, choose the content marketing metrics that actually support those goals. This is where many teams get lost in data, or even let it hurt their business, because they start measuring everything and anything.
So, keep it hyper-focused and only use metrics that specifically reflect your business objective. For example:
- If you want more brand visibility, measure traffic, impressions, and brand mentions.
- If you need more engagement, check time on page, scroll depth, natural backlinks, and engagement metrics.
- If you want conversions, track the number of signups or unique visitors to your BoFu content.
3. Gather the Data
Next, collect the metrics from all the tools you’ve picked before. Some teams do this weekly or campaign-based, others monthly or quarterly.
There is no right or wrong here. So, just choose what makes sense for your goals.
4. Analyze the Results
Numbers never tell the full story, and you always have to add an extra layer of explanation. In other words, the most important part of content marketing reporting is interpretation.
Ask questions like:
- Which content pieces performed best?
- What topics generated the most engagement?
- Which channels brought the most traffic?
This analysis essentially helps improve your future campaigns. And it shows what actually works right now.
5. Present Your Insights
This last step is all about summarizing your findings.
Instead of just listing metrics, explain what the data means for your content strategy moving forward. Focus on actionable findings, not raw stats as such.
Even better if you can tell a story behind that data (remember that visual above?).
Conclusion
An effective content marketing report isn’t just about how much data you have or even how credible it is.
It’s often about interpretation.
It’s about how you use it and what angle you’re looking at it from.
So, if there is one thing every business should focus on, it’s the bigger picture of your content marketing and how it ties back to your business goals.