

Why Facebook’s attribution data is mostly guesswork
One of the biggest challenges when running ads is measuring accurate attribution data. This is difficult for a number of…


Short answer
You know your ads are profitable when you can connect ad spend to real revenue from your payment processor or CRM, not to conversions reported by the ad platform. Then compare that revenue to what you spent over a realistic time window. If you're judging profitability from Facebook or Google's dashboards alone, you're seeing each platform's version of events, and it almost always overstates results.
If you’ve ever looked at a Facebook Ads dashboard showing a 4x ROAS while your bank account tells a different story, you’re not imagining things. This is one of the most common frustrations in digital marketing. It’s also fixable.
Most businesses can’t tell whether their ads are profitable because their ad data and their revenue data live in separate systems that don’t talk to each other.
Your ad platforms know who clicked. Your CRM or checkout knows who bought. Without something connecting those two records at the contact level, you’re left guessing. You can trust the ad platform’s numbers, or you can stare at a spreadsheet trying to line up dates. Contact-level journey reporting closes that gap by tying every click, opt-in, and purchase to the same person.
A few other things make this harder:
Facebook (Meta) ad reporting rarely matches actual revenue because Meta uses its own attribution rules, includes modeled conversions, and counts sales that other channels also claim.
Here’s what’s happening behind the scenes.
View-through attribution inflates results. By default, Meta credits a conversion to your ad if someone clicked within a set window or simply viewed the ad within a shorter window. Someone who scrolled past your ad and bought a day later because a friend recommended you still counts as an ad conversion.
Every platform claims the same sale. Facebook, Google, TikTok, and your email tool each report conversions independently. Add up what each platform says it generated, and you’ll often get more revenue than your business actually made. This is called double counting, and it’s one of the biggest reasons “my ads person paints one picture, but I’m not seeing it on the bottom line.” We break down this “greedy attribution” problem in detail in Why Facebook’s Attribution Data Is Mostly Guesswork.
Modeled conversions are estimates. When the pixel can’t observe a conversion directly, Meta estimates it statistically. These numbers are useful for the algorithm, but they aren’t a ledger of real transactions.
The platform grades its own homework
Ad platforms are incentivized to show strong performance. That doesn't mean the data is fake, but it does mean you need an independent second set of eyes.
Ad attribution is the process of assigning credit for a sale or lead to the marketing touchpoints that influenced it. Good attribution answers the question “Which ads, campaigns, and channels actually produced revenue?” and does it using your real sales data.
| Model | How it assigns credit | Best for |
|---|---|---|
| First touch | 100% to the first interaction | Understanding what generates awareness and new leads |
| Last touch | 100% to the final interaction before purchase | Understanding what closes the sale |
| Linear | Equal credit to every touchpoint | Seeing the full journey without bias |
| Position-based (U-shaped) | Most credit to first and last touch, the rest split between the middle touchpoints | Balancing acquisition and conversion |
| Time decay | More credit to touchpoints closer to the sale | Short sales cycles and promotions |
No single model is “correct.” The real value comes from comparing models side by side. An ad that looks weak on last touch might be your best lead generator on first touch. SegMetrics lets you switch between attribution models on the fly, including First Visit, Opt-in, Purchase, and a linear model that credits every touchpoint equally. See how each attribution model works for a full breakdown.
True ROAS (return on ad spend) is calculated by dividing actual revenue from customers acquired through an ad by what you spent on that ad. The revenue should come from your payment processor or CRM, not the ad platform.
True ROAS = Verified Revenue from Ad-Acquired Customers ÷ Ad Spend
To get there, you need three things:
Once you’re measuring correctly, here’s how to improve your ROAS.
Measure both. First-purchase ROAS tells you whether an ad pays back quickly. LTV-based ROAS tells you whether it’s worth scaling. An ad with a 0.8x first-purchase ROAS can be one of your most profitable campaigns if those customers go on to buy again. An ad with a 3x ROAS on a one-time discount offer might attract customers who never return. Lifetime value tracking ties every future payment back to the ad that brought the customer in.
Checking ROAS at 30, 60, and 90 days after acquisition gives you a much clearer picture than a single snapshot. SegMetrics’ Optimization Reports show this by channel, campaign, and funnel step.
Scale ads that produce customers at a profitable cost based on verified revenue and lifetime value. Pull back ads that only look good inside the ad platform’s reporting.
A simple decision framework
That last category is where most wasted ad spend hides. To set your thresholds, compare customer acquisition cost against lifetime value using these marketing metrics that drive higher ROI.
The best-performing ad platform is the one that produces the most verified revenue per dollar spent, measured with the same attribution rules across every platform.
Comparing platforms using their own dashboards is like comparing students who each graded their own test. Facebook uses Facebook’s attribution window. Google uses Google’s. To compare fairly, you need one neutral system applying the same model to every channel.
When businesses do this comparison consistently, they often find the platform they were about to cut was quietly starting most customer journeys. They also find that the platform with the best-looking dashboard was taking credit for sales that would have happened anyway. If Google is part of your mix, these 12 key levers for optimizing Google Ads can help once you know what it’s truly worth.
To track attribution for a launch, set up tracking before launch day. Tag every ad, email, affiliate link, and social post with consistent UTMs. Make sure every lead is captured with their source at opt-in. Then connect those leads to purchases when the cart opens.
A launch attribution checklist
Launches move fast. If you wait until after the cart closes to figure out attribution, you’ve lost your chance to move budget toward what’s working while it matters.
You likely need more advanced attribution if any of the following are true:
Advanced marketing attribution software connects your ad platforms, CRM, email tool, and payment processor. It then shows the full customer journey from first click to final purchase, independent of what any single ad platform claims. Compare your options in The Best Marketing Attribution Tools for 2026, or see how SegMetrics stacks up as an alternative to Hyros.
SegMetrics connects your ad accounts, CRM, and payment data so you can see which ads, campaigns, and channels are producing real revenue, including repeat purchases and lifetime value. Instead of trusting each platform’s version of the truth, you get one independent view of your ad performance. It’s built for marketers and agencies who need to decide what to scale, what to cut, and how to prove it. See pricing and start a 14-day free trial.
Facebook ads reporting is directionally useful but not a reliable measure of actual revenue. It includes view-through conversions, modeled estimates, and sales other channels may also claim. For profitability decisions, verify results against your own sales data.
A good ROAS is any figure above your break-even point, which depends on your margins. A business with 80% margins can profit at a much lower ROAS than one with 20% margins. Calculate break-even ROAS as 1 divided by your profit margin.
ROAS measures revenue divided by ad spend. ROI measures profit divided by total investment, accounting for product costs, fees, and other expenses. ROAS tells you whether ads drive sales. ROI tells you whether those sales make money.
Each platform reports conversions independently, using its own attribution rules. When a customer interacts with several platforms before buying, each one may claim the full sale. The result is double or triple counting.
Wait at least as long as your typical sales cycle. If most customers buy two to three weeks after opting in, judging an ad after three days will undervalue it.
Multi-touch attribution spreads credit for a sale across multiple marketing interactions instead of giving it all to one. It helps you see how channels work together, such as a Facebook ad that starts a journey and an email that closes it. Learn more about how attribution works in SegMetrics.

Denise Cullom is an innovative and goal-oriented Operations Lead committed to professional development and expert leadership of teams, systems, and profitability. Recognized for repeatedly surpassing business goals, she is a decisive leader and strategic planner known for rallying stakeholders behind new initiatives. Denise is adaptable to changing business needs and market conditions, continuously driving success and growth.
One of the biggest challenges when running ads is measuring accurate attribution data. This is difficult for a number of…

Ready to boost your return on ad spend? Discover the 12 key levers that ad agencies use to optimize your Google Ads.

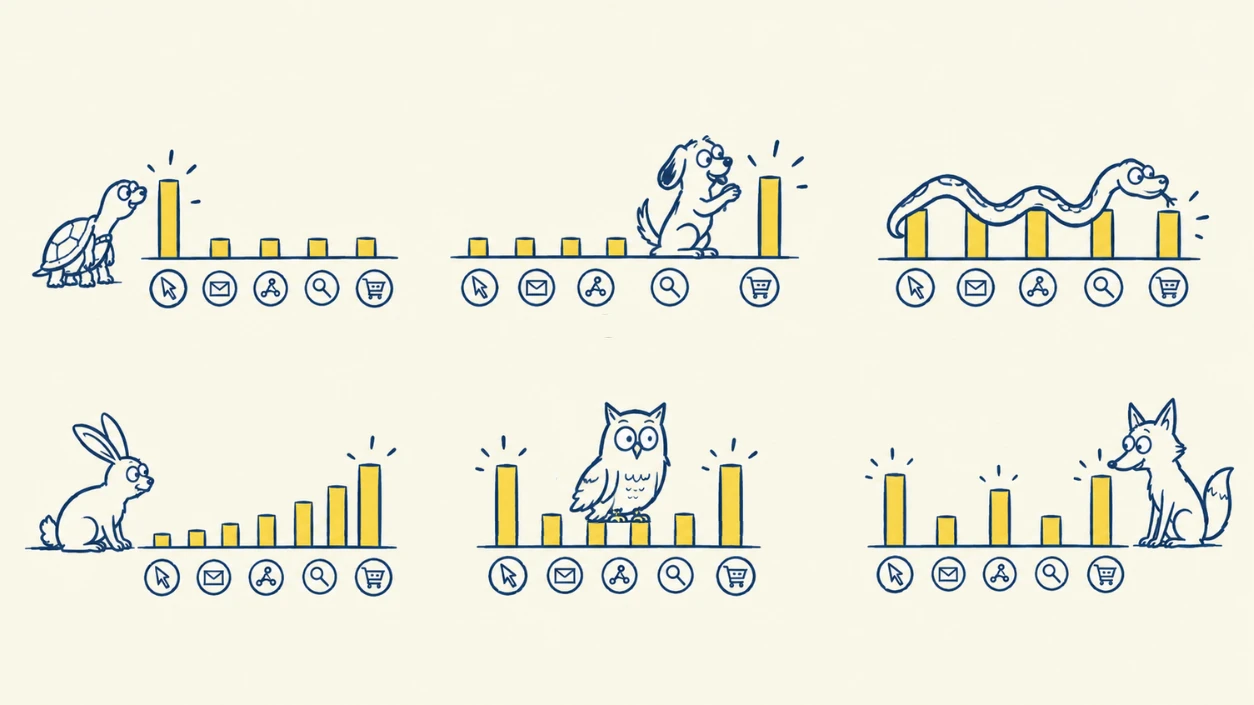
First-touch, last-touch, linear, time-decay, position-based, and W-shaped. Learn what each attribution model actually does (plus a simple way to pick the right one every time).

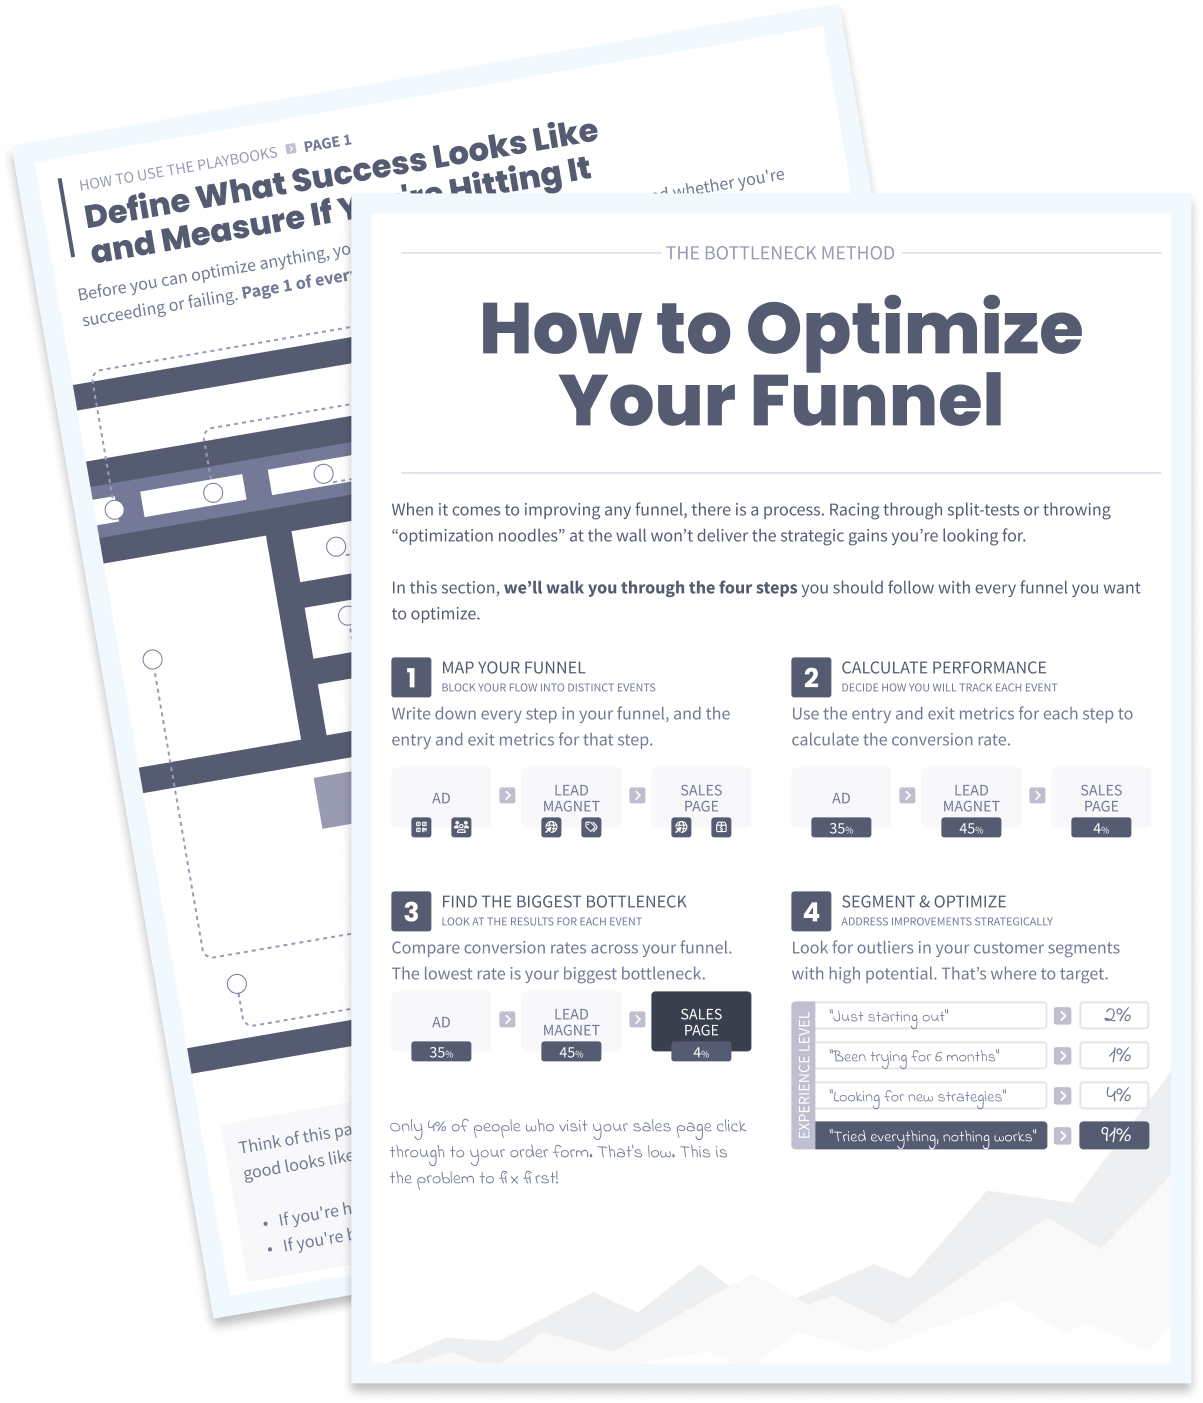
Start your 14-day free trial of SegMetrics today!