

What is marketing attribution? (And why does it matter?)
Marketing attribution, explained without the jargon. Learn what attribution is, how it works, and why most marketers (and AI) get it wrong.

Tracking & Reporting
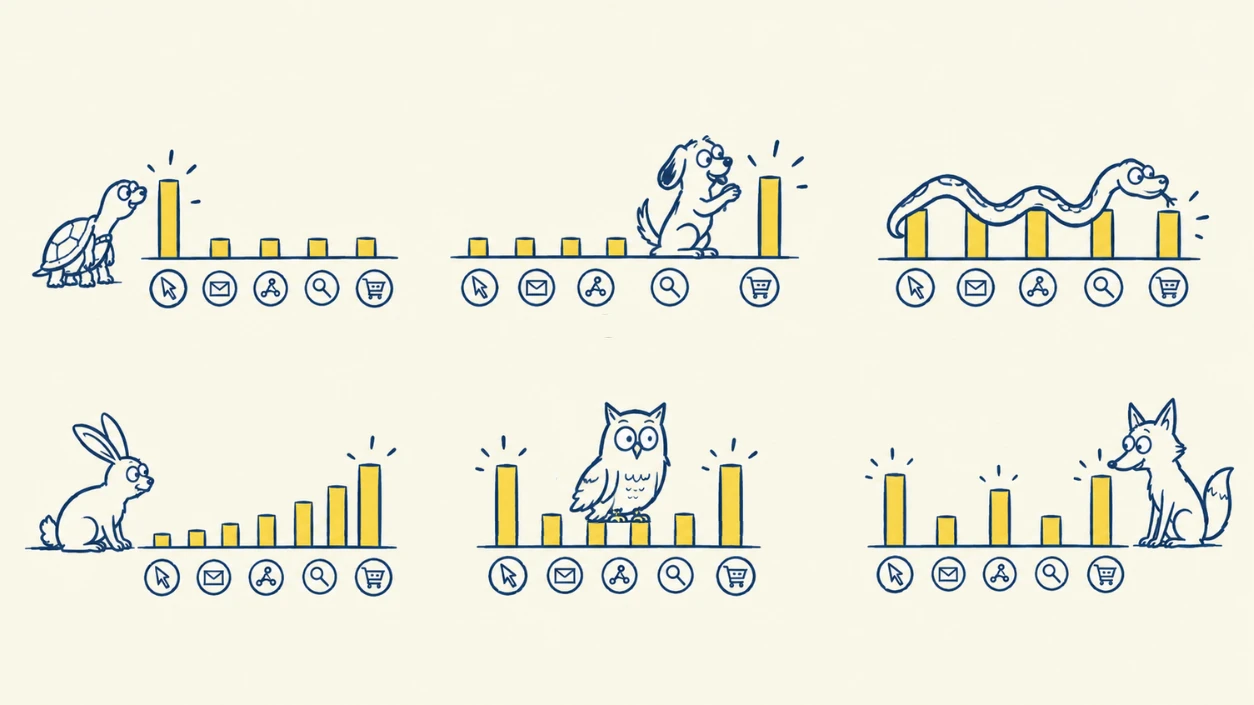
A marketing attribution model is a rule for deciding which touchpoints get credit for a sale. The six main models are first-touch, last-touch, linear, time-decay, U-shaped, and W-shaped. Single-touch models hand all the credit to one touchpoint. Multi-touch models split it across several.
Which one should you use? That depends on the question you’re trying to answer.
First, let’s walk through all six types of attribution models — what each one does, how it assigns credit, and when it’s the right tool — then we’ll look at a simple framework for choosing which to use.
Picture a real customer journey. Someone clicks a Facebook ad, browses your website, downloads a lead magnet, reads an email, then attends a webinar. At the end of the webinar, they buy your product.
That’s (at least) five touchpoints leading up to one sale. Which of those touchpoints is responsible for that sale?
An attribution model is how you divide the credit for that sale among those five touchpoints.
Attribution can be divided into two types based on how many touchpoints get credit:
Neither approach is “right.” They answer different questions. Picking the model that matches your question is what really matters.
Let’s dig into each model.
Single-touch models are blunt on purpose. One touchpoint gets all the credit. Everything else gets none. That sounds crude, but it’s exactly what you want when you have a question about the start or the end of the journey.
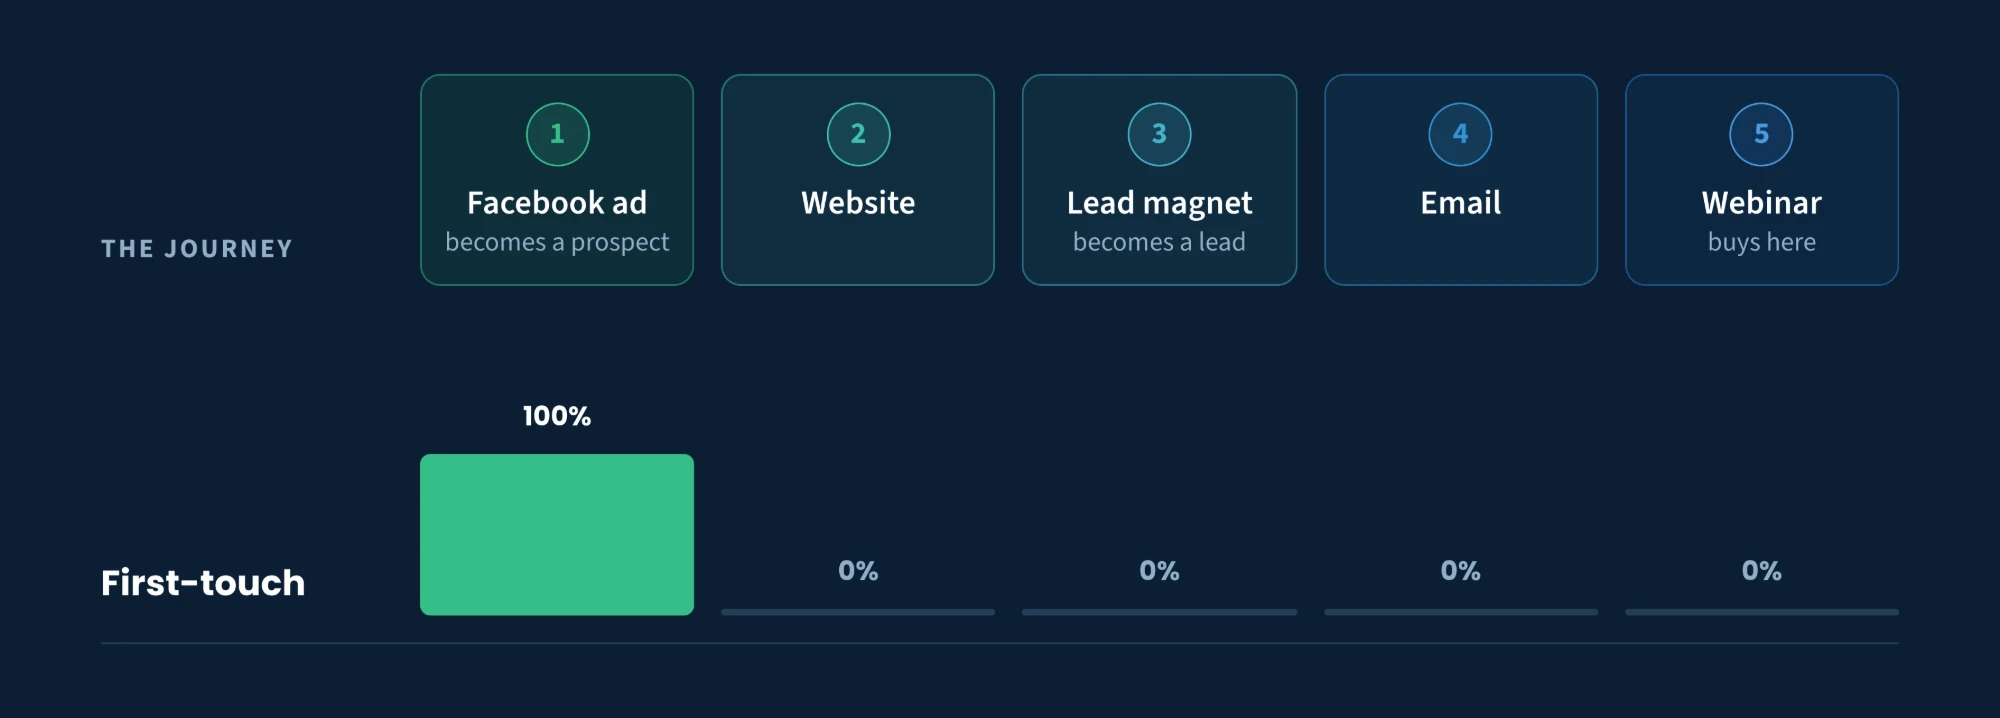
How it assigns credit: 100% to the very first touchpoint. AKA, the thing that first brought someone into your world.
First-touch attribution answers one question: “Where do my leads come from?” If someone’s journey started with a podcast interview six months ago, first-touch gives the podcast full credit for every sale that follows, no matter how many emails and ads came later.
Use first-touch attribution when you’re digging into acquisition. It highlights your top of funnel activities that are actually introducing you to future customers.
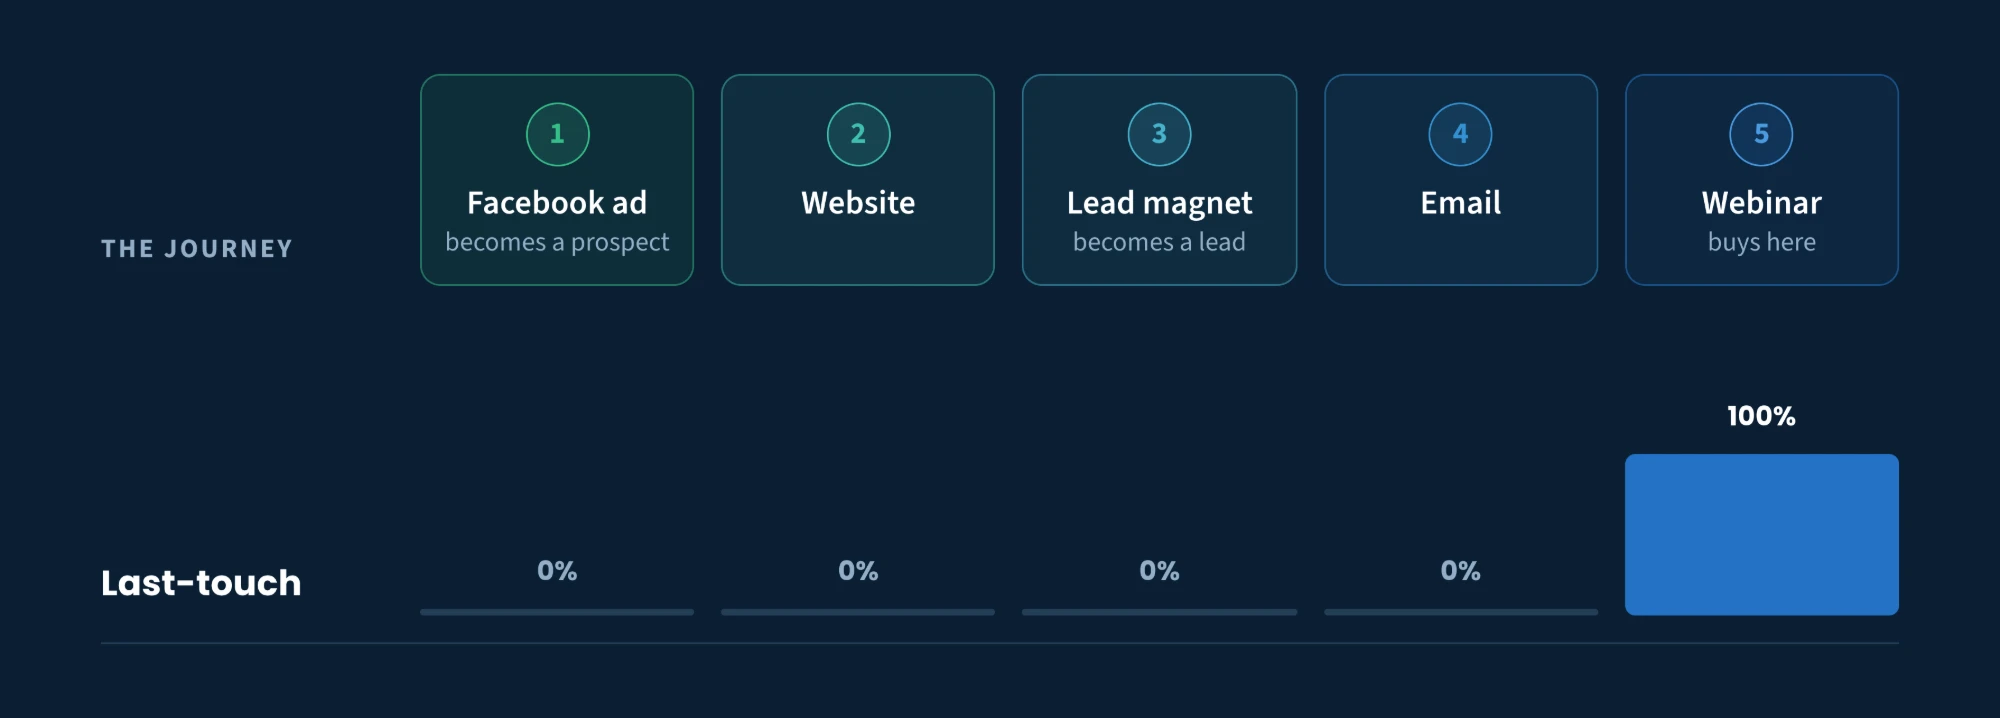
How it assigns credit: 100% to the last touchpoint before the purchase.
Last-touch attribution (sometimes called last-click) answers the opposite question: “What tipped them over the line?” It’s the model for understanding what closes the sale.
One important asterisk: the literal last touch is often something useless, like your checkout page or a direct visit. So when people say “last-touch,” they almost always mean the last meaningful, non-direct touch, like the final email or ad they clicked before buying. That’s the marketing action worth tracking.
Use it when you want to know which email, ad, or offer does the closing.
Multi-touch models split the credit across several touchpoints instead of just one. This gives you a more “complete” picture of how your marketing funnel is operating (but this comes with a big warning, which we’ll discuss).
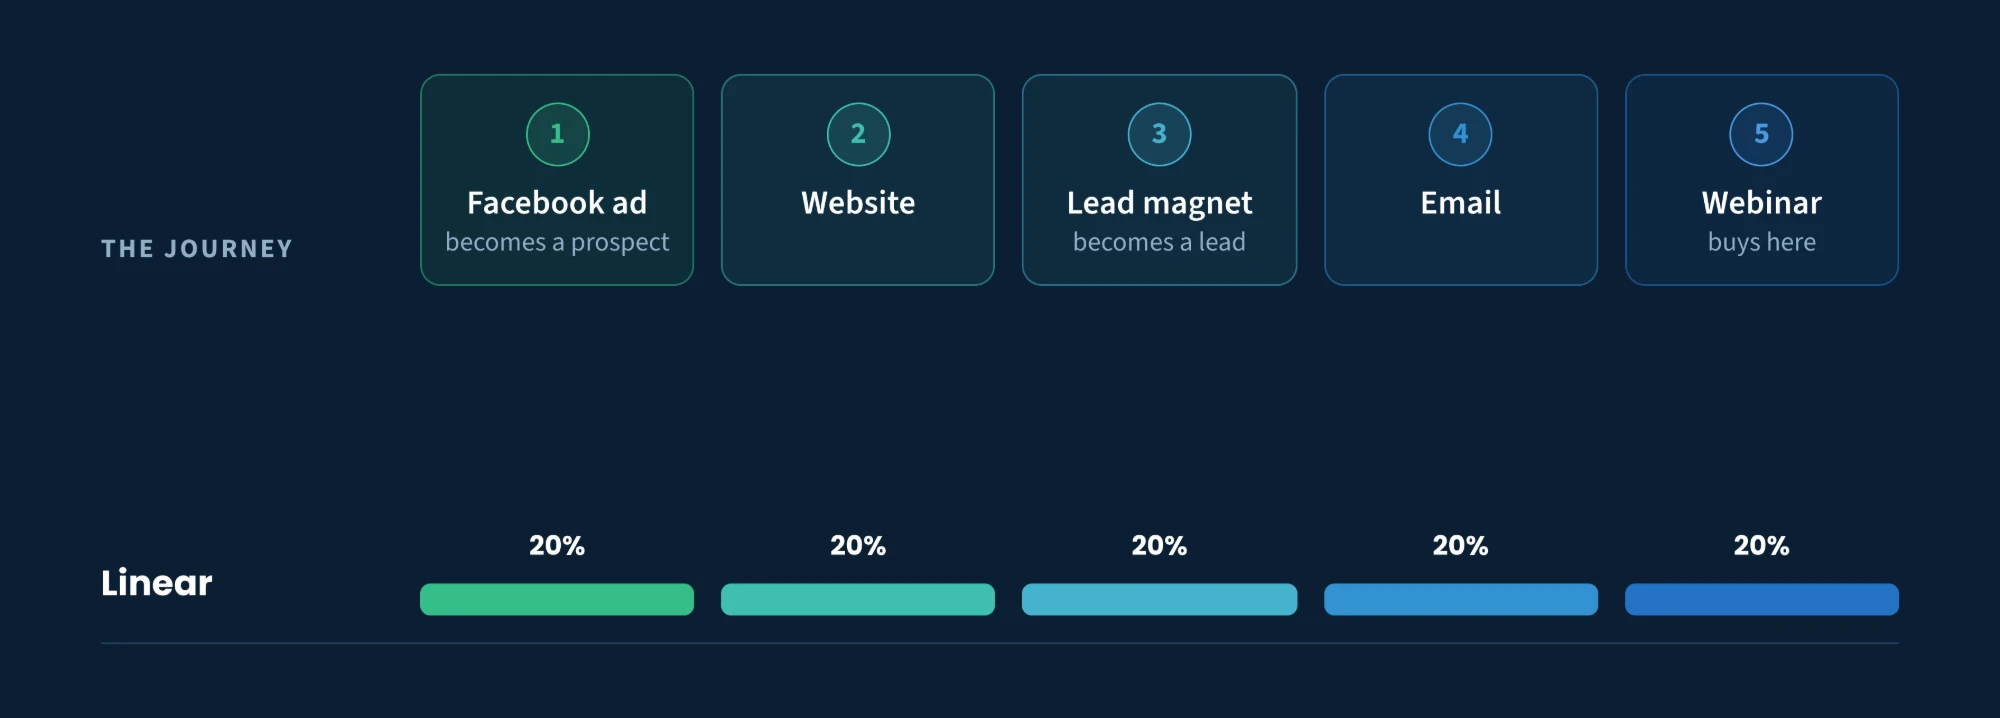
How it calculates credit: Every touchpoint in the journey gets an equal share. Four touchpoints, 25% each. Ten touchpoints, 10% each.
Linear attribution is the simplest multi-touch model, and it’s the closest thing to a true “full-funnel” view. Linear treats every step as having mattered. It won’t tell you which touch mattered most, but it’s a clean way to see everything that was involved.
Use it when you want a balanced, no-favorites view of the whole journey.
If you have a long, multi-channel sales cycle, really saying which touchpoints caused a sale may be unrealistic. But linear attribution allows you to look at influence, not just cause. Linear attribution highlights all of the marketing actions which support your prospects along the way (even if they don’t individually close the deal).
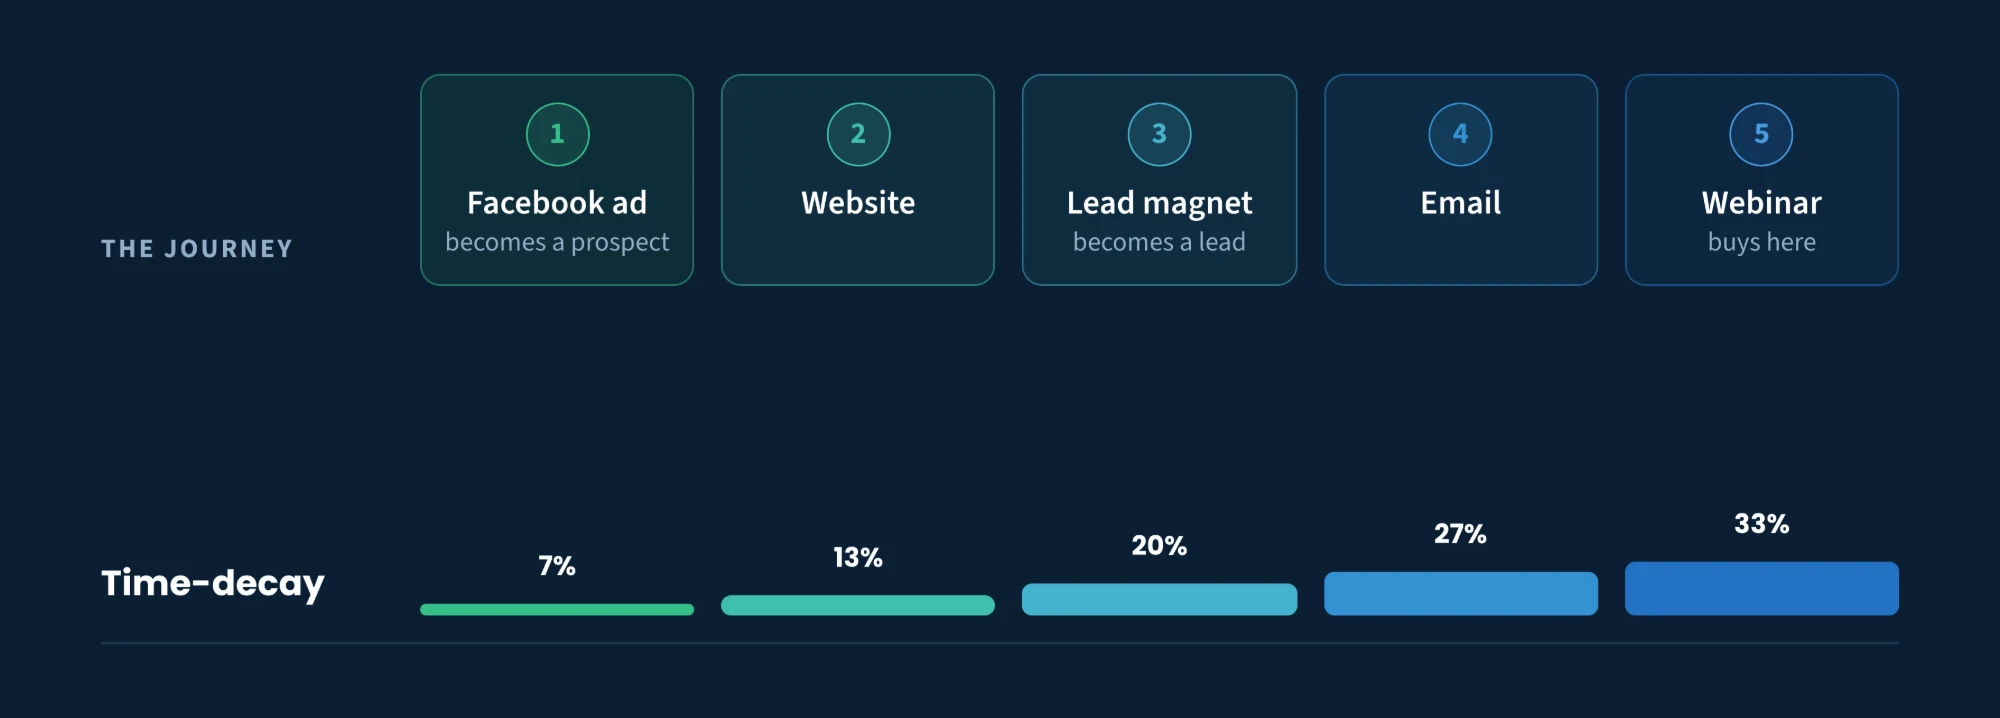
How it calculates credit: Touchpoints closer to the purchase get more credit. Earlier ones get less, on a sliding scale.
The logic: the email someone clicked the day they bought probably mattered more than the ad they saw three months earlier. Time-decay attribution bakes this assumption into the model. So in a three-month nurture sequence, the webinar someone attended last week outranks the Facebook ad they clicked back in month one.
Use it when you have longer sales cycles and you believe recent touches do the heavy lifting. This is common in nurture-driven funnels.
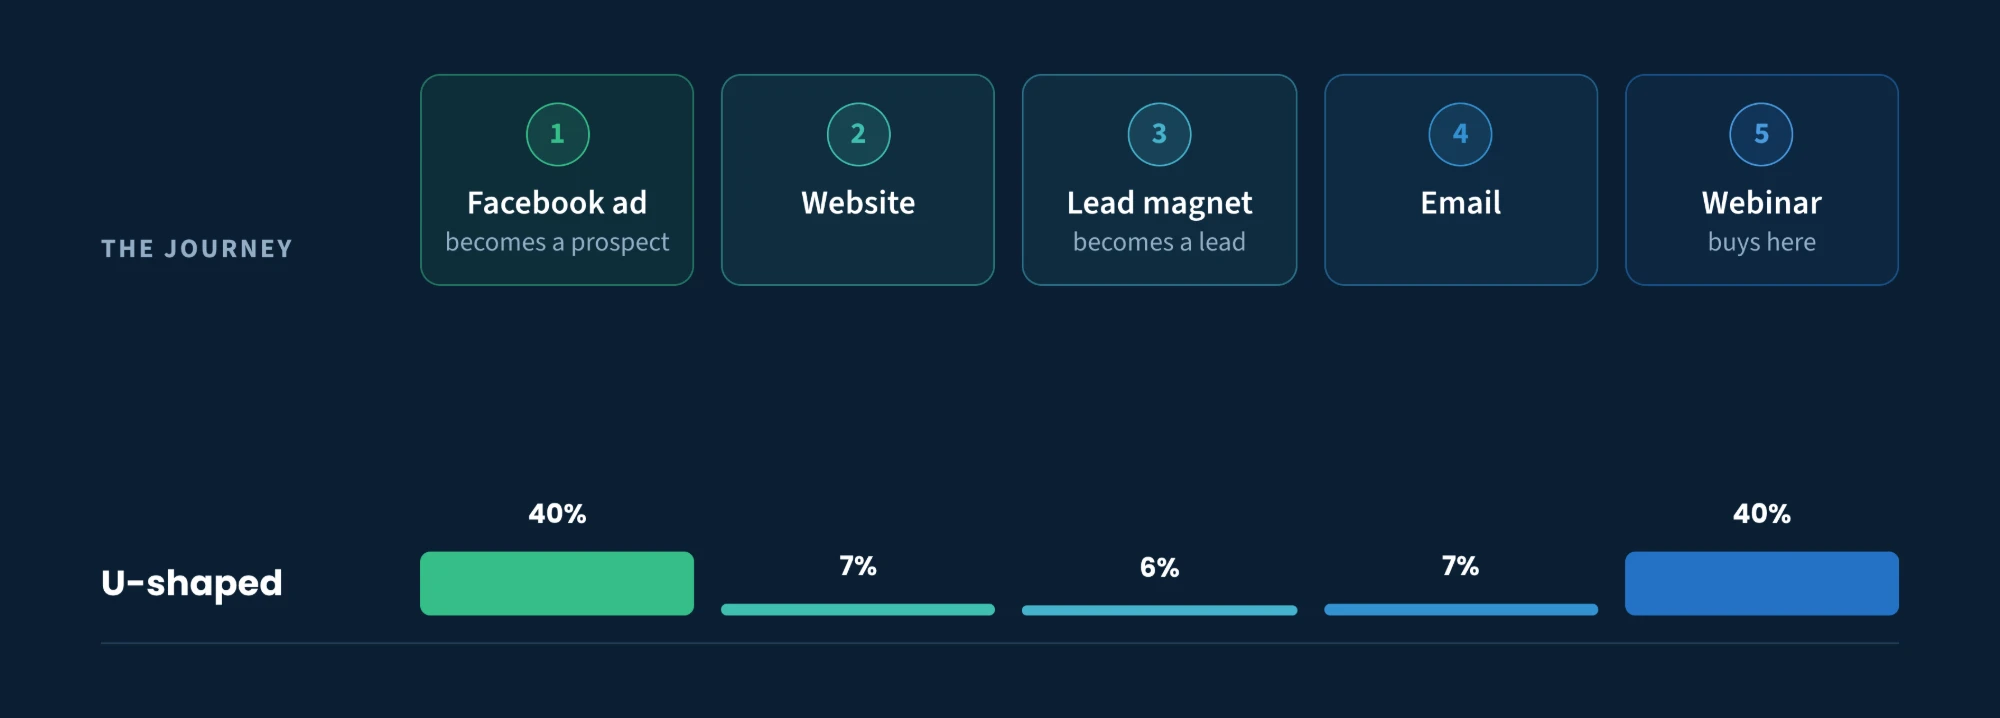
How it calculates credit: The first and last touchpoints get the biggest shares (typically 40% each), and the touches in the middle split the remaining 20%.
Position-based says the two moments that matter most are discovery (how they found you) and conversion (what closed them). And the middle is just a supporting, secondary role. Like a U, it’s heavier on both ends. So the Facebook ad that first pulled you in and the webinar that finally closed you each take 40%, while the three steps in between split the remaining 20%.
Use it when you care about both acquisition and closing and don’t want to ignore either end.
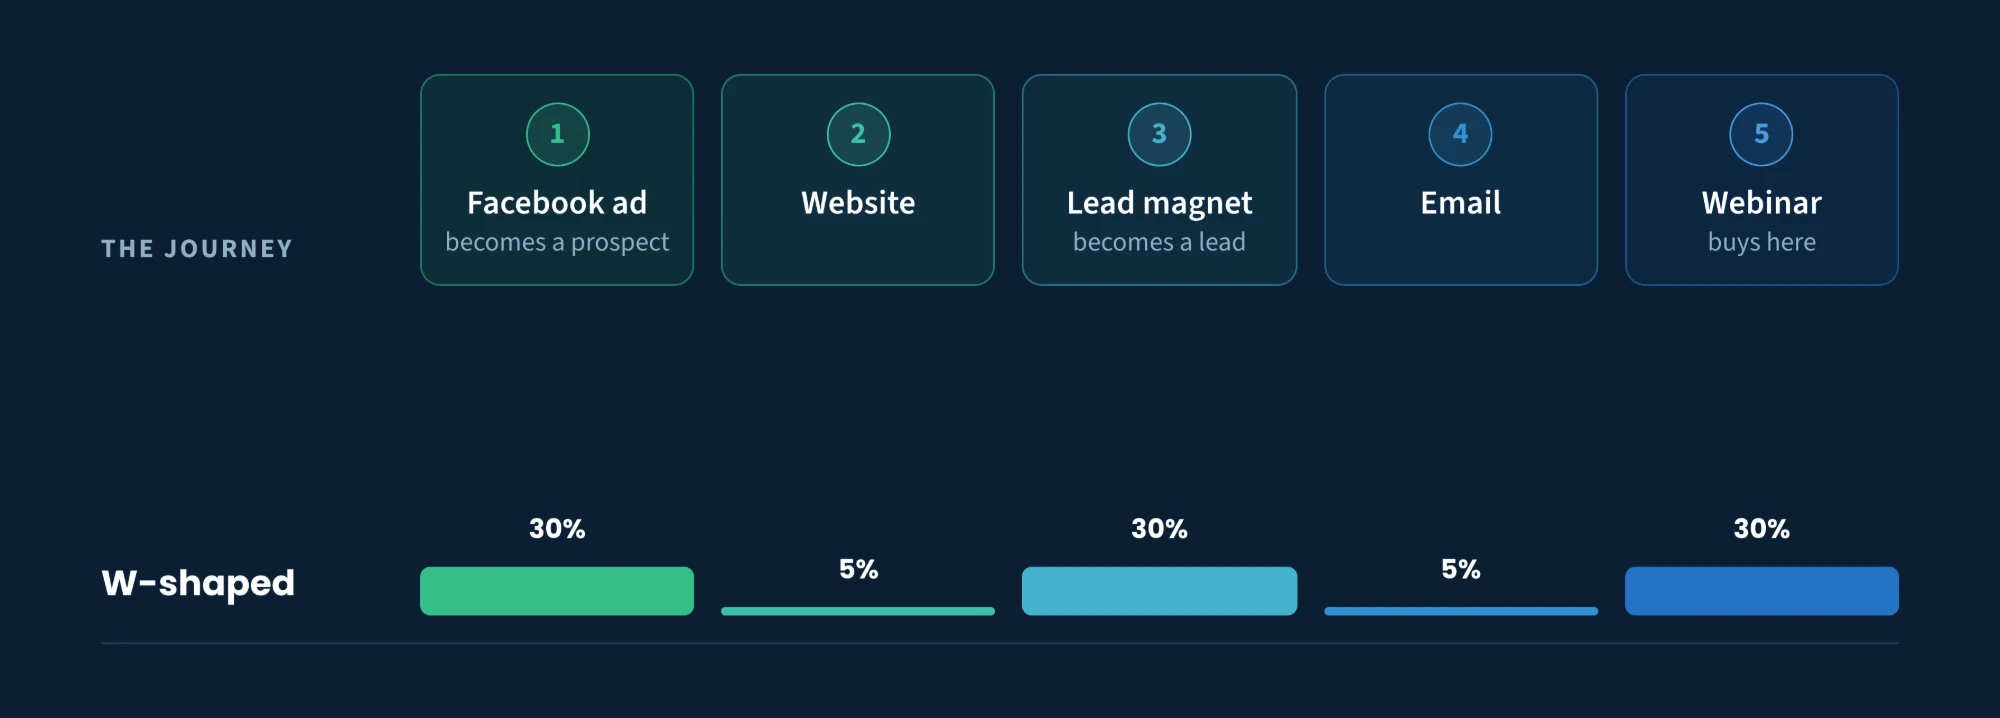
How it calculates credit: W-shaped works like U-shaped, but it adds a third heavily-weighted milestone in the middle. This is usually the moment someone becomes a lead. So first touch, lead-creation, and last touch each get a big share (often ~30% each), and the rest split the remainder.
W-shaped is for businesses that treat becoming a lead as a real, credit-worthy event, not just a step on the way. It’s the most complex of the “shaped” models (outside of custom-built attribution models).
Use it when lead creation is a distinct, meaningful stage in your funnel worth measuring on its own.
A quick warning about multi-touch
Multi-touch models look sophisticated and feel advanced… and that's a trap. More complicated attribution models don't mean the answers you get are better or more actionable. Often, multi-touch models just smooth everything into an average that doesn't answer anything.
So focus on the question you want to answer, then pick your attribution model.
If you’ve spent time in GA4 or Google Ads, you’ve seen a model that isn’t in the classic six: data-driven attribution (DDA). It’s worth understanding because it’s now Google’s default.
How it works: Instead of using a fixed rule (like “40% to the first touch”), data-driven attribution uses an algorithm that looks at your account’s actual conversion data and learns how much each touchpoint tends to contribute, then assigns fractional credit based on those patterns. In theory, it’s the most tailored model of all. The credit split comes from your data, not a rule of thumb.
The catch: Google’s data-driven attribution is a black box. You can’t fully see why it credited a touchpoint the way it did. Plus, DDA needs a high volume of conversions to work well, which you may not have. Worst of all, DDA is still Google grading its own homework. It runs inside Google’s ecosystem, on data only Google can see, and it rarely includes your whole funnel.
For most of our audience, data-driven attribution is something to understand rather than rely on. If you can’t trace the number back to real people and real journeys, it’s hard to make a confident decision from it.
Some attribution tools provide additional or specialty attribution models. For example, SegMetrics also offers First Engagement Attribution. This is like first-touch attribution, but it prioritizes the first touchpoint within a report’s timeline. In other words, instead of identifying the lifetime first touchpoint, a First Engagement model might identify the first touch point within the last 30 days. This helps you see what marketing actions are driving engagement recently.
Never pick an attribution model because it’s fancy. Pick it because it answers your question. So start with the question.
| If you want to know… | Use this model |
|---|---|
| Where my best leads come from | First-touch |
| What closes the sale | Last-touch |
| Everything that was involved, weighted equally | Linear |
| Which recent touches do the closing | Time-decay |
| Both how they found me and what closed them | Position-based (U-shaped) |
| How they found me, when they became a lead, and what closed them | W-shaped |
Most businesses don’t need all six. In our experience, you really only need three views to run your marketing well:
That’s it!
Master those three questions and you’ve covered about 99% of your use cases.
Not at once. But you can switch between attribution models to look at your data from different angles. The key is understanding what the attribution model is telling you.
(Note that most platforms – especially ad platforms – lock you into a single model. One of the biggest benefits of marketing attribution software is that you get full control of the attribution models you use.)
The complete guide to marketing attribution walks through how these models fit the bigger picture of marketing attribution. If you’re fuzzy on the basics, start with what marketing attribution is. And remember that your attribution window — how far back you count touches — changes these numbers too.
Models are abstract until you watch one sale move around. Let’s return to our original customer journey. Say someone buys a $2,000 course after this journey:
Watch how the credit — and the story — can change by model:
Same customer. Same $2,000. Six completely different conclusions about where to spend your next dollar.
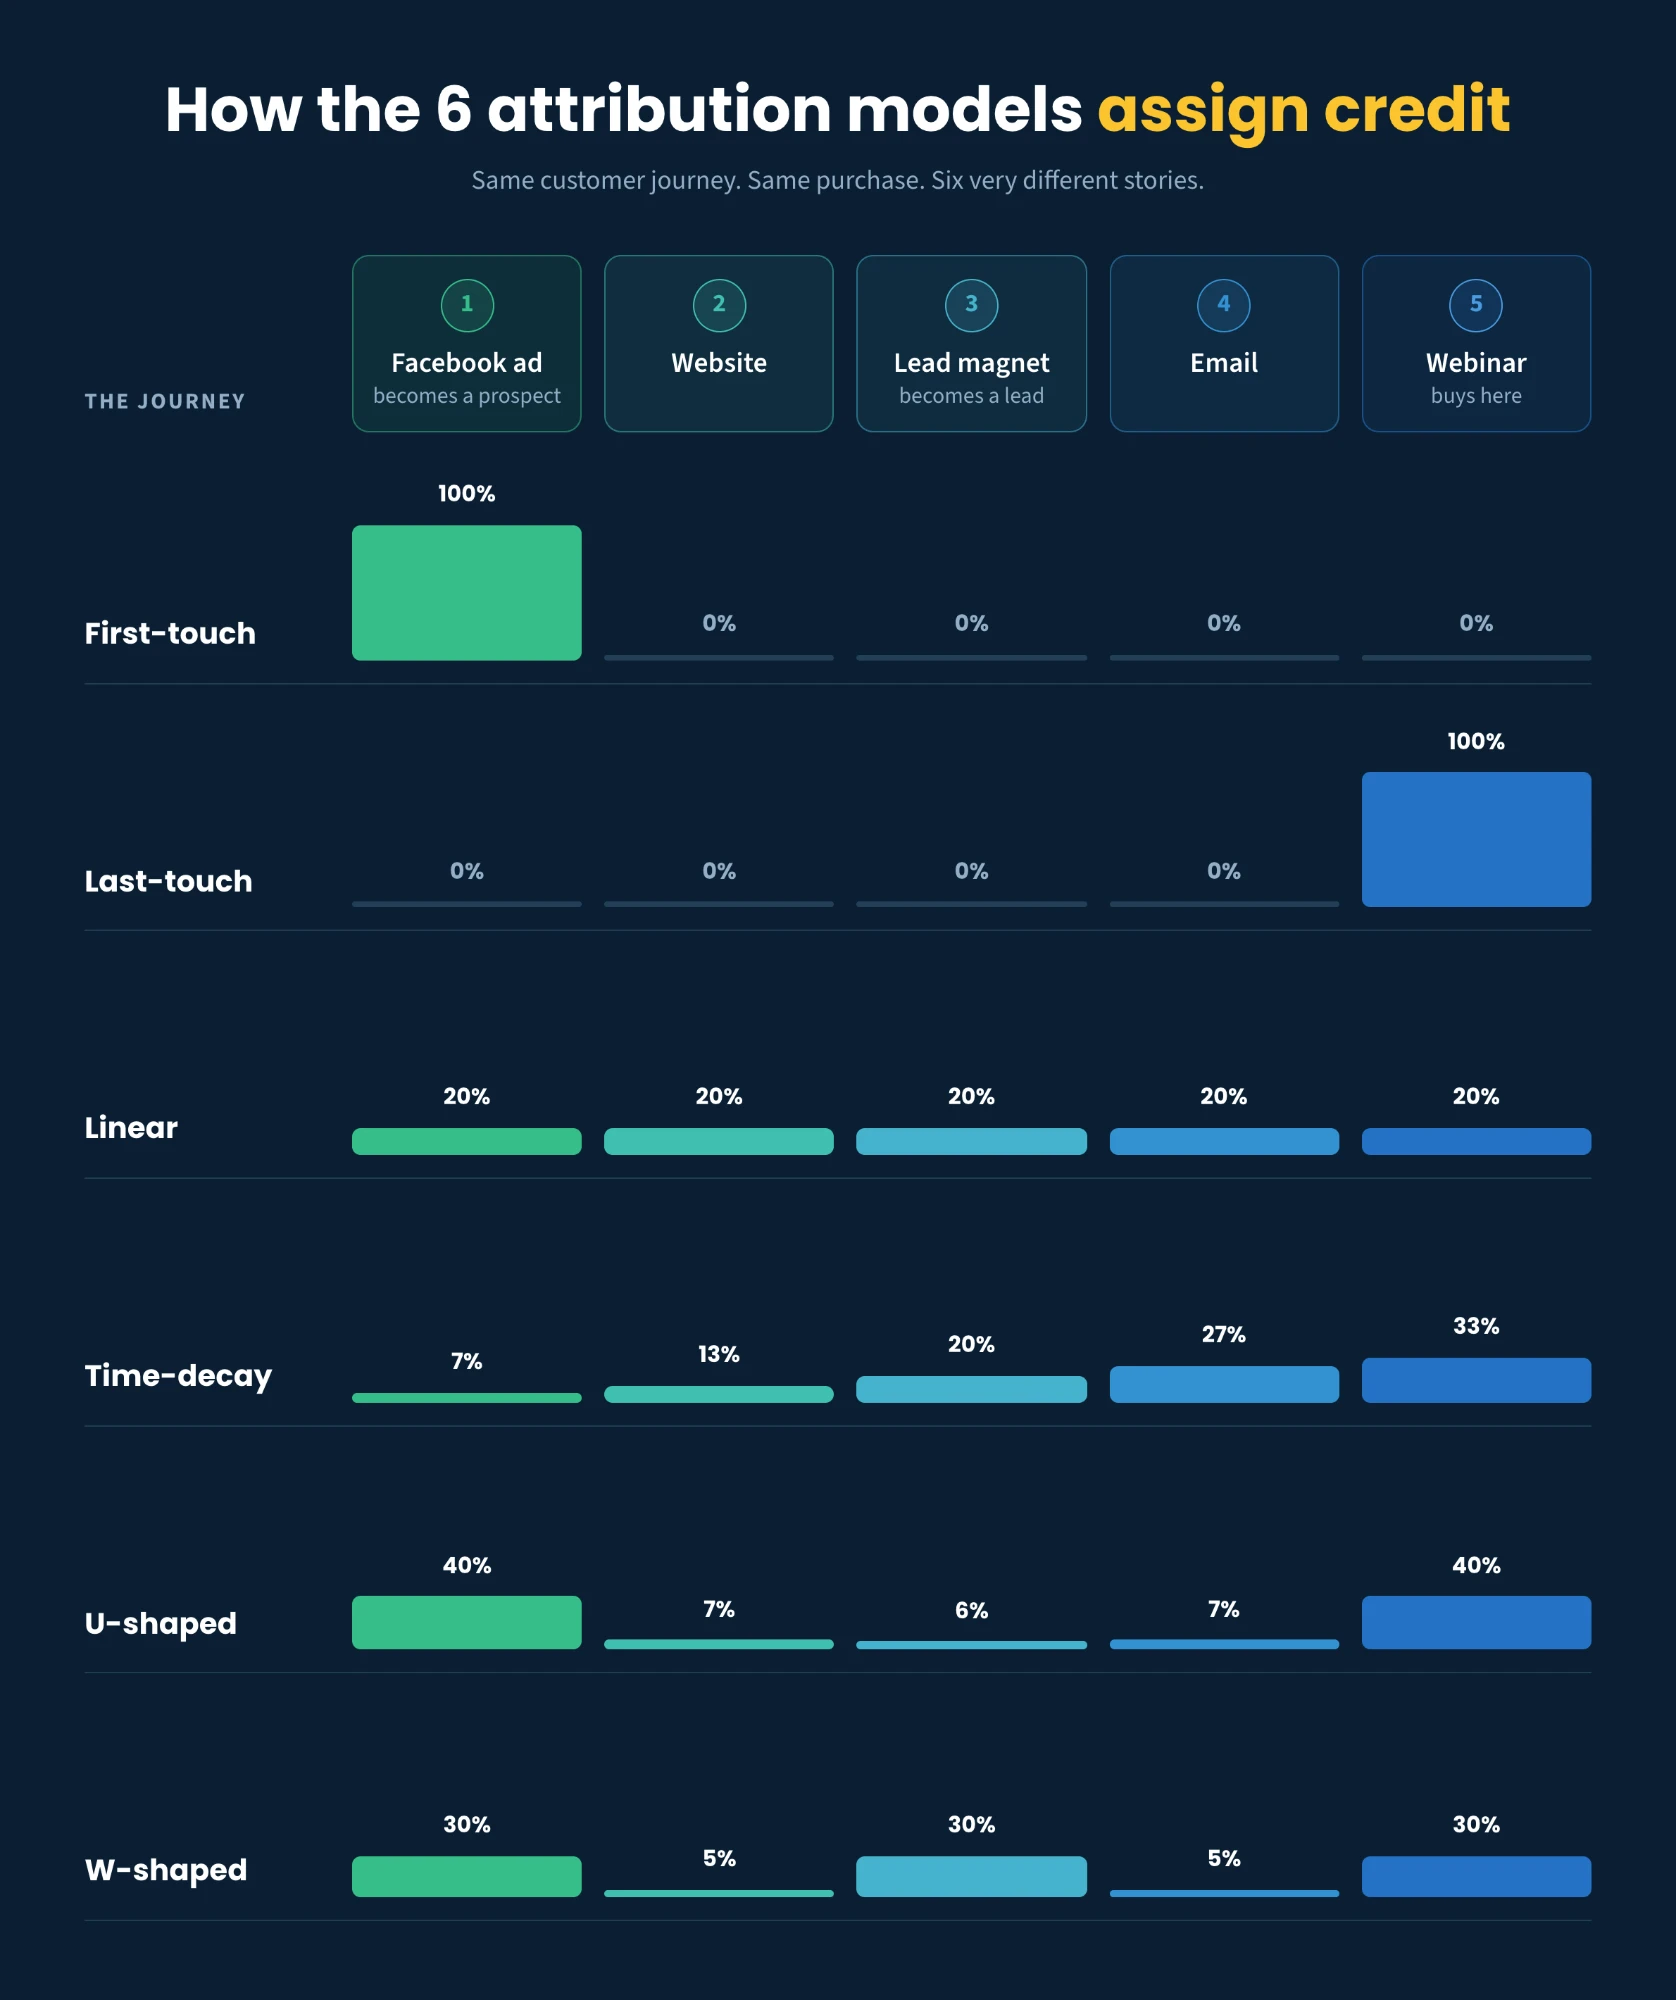
This is exactly why “which model?” isn’t just a technicality. This question shapes how you understand your marketing.
Understanding attribution models, you can better understand your results. In our example:
A good attribution tool will not just help you assign credit, it will also allow you to find the outliers at each stage of your funnel and compare the performance of different segments. This is where attribution meets optimization.
Here’s a breakdown of the 6 core principles of marketing analytics (including how to leverage outliers and segments to understand your data at a deeper level).
What is an attribution model? An attribution model is a rule for deciding which marketing touchpoints get credit for a conversion. Some models give all the credit to a single touchpoint (first-touch or last-touch). Some split credit across the whole journey (linear, time-decay, position-based, W-shaped). The model you choose determines which channels and campaigns look successful.
What are the six attribution models? First-touch (credit to the first touchpoint), last-touch (credit to the last), linear (equal credit to all), time-decay (more credit to recent touches), U-shaped (most credit to first and last), and W-shaped (most credit to first, lead-creation, and last). You’ll also run into Google’s data-driven model, which uses an algorithm instead of a fixed rule.
What’s the difference between first-touch and last-touch attribution? First-touch gives 100% of the credit to the touchpoint that first brought someone in. AKA, “Where did this lead come from?” Last-touch gives 100% to the final touch before the purchase. AKA, “What closed the sale?” First- and last-touch often credit completely different channels. Most importantly, both can be right because they answer different questions.
Which attribution model is best? There’s no single best model! The right one depends on what you want to know. Use first-touch to learn where leads come from, last-touch to learn what closes them, and linear to see what influenced them along the way. Most businesses only need these three.
What is multi-touch attribution? Multi-touch attribution splits credit across several touchpoints in a journey instead of crediting just one. Linear, time-decay, U-shaped, and W-shaped are all multi-touch models. Multi-touch gives a fuller picture, but it can smooth everything into an average that’s hard to act on.
What is data-driven attribution? Data-driven attribution is Google’s default model. Instead of a fixed rule, it uses an algorithm to study your account’s conversion patterns and assign fractional credit to each touchpoint. It’s tailored to your data, but it’s a black box, needs high conversion volume, and only sees the part of the funnel Google can track.
The fastest way to understand attribution models is to stop reading about them and start seeing it applied to your own data. A good attribution tool lets you toggle between attribution models in real time and see how different questions shape the data.
Start your free 14-day trial to see your funnel under first-touch, last-touch, and full-funnel attribution in a few clicks.
New here? The complete guide to marketing attribution ties it all together. Also check out our guide to cross-device attribution.
Keith is the Founder of SegMetrics, and has spent the last decade working on optimizing marketing funnels and nurture campaigns. SegMetrics was born out of a frustration with how impossibly hard it is to pull trustworthy, complete and actionable data out of his client’s marketing tools.
Marketing attribution, explained without the jargon. Learn what attribution is, how it works, and why most marketers (and AI) get it wrong.

Ad Tracking, Tracking & Reporting
What an attribution window is, how it differs from a lookback window, what each ad platform's default actually is, and why a short window quietly hides your best-performing ads.
Guide, Articles, Tracking & Reporting
In a world where marketing is driven by data, understanding how your data is analyzed is just as important as…

Start your 14-day free trial of SegMetrics today!